Weekly Reading for 9/25 - 9/29
Bears enjoying start of the Fall season
Due to travel and other commitments this week, I couldn't prepare my usual weekly reading newsletter in advance of today's Sunday open.
Given the time constraints, I'm delivering a concise version in a short format, reminiscent of my previous posts on X (formerly Twitter).
Nevertheless, this brief update captures the essence of my market bias, highlighting key support and resistance levels, as well as the conditions under which I'd consider changing my trading bias. I trust you'll still find this format valuable in your trading plan this week.
It's worth noting that by the end of this week, monthly and weekly candles will have formed on the chart. Historical data suggests that September tends to be the most bearish month, so we may see further downside in the market.
This sentiment aligns with last week's close, which indicates a similar outlook across all four index futures.
However, as you're aware, I'm always ready to adjust my bias swiftly when the price action warrants it. That's why I'll specify when I plan to shift from a bearish to a bullish stance, based on the daily close reaching certain levels for each of these index futures.
Quick look at last week:
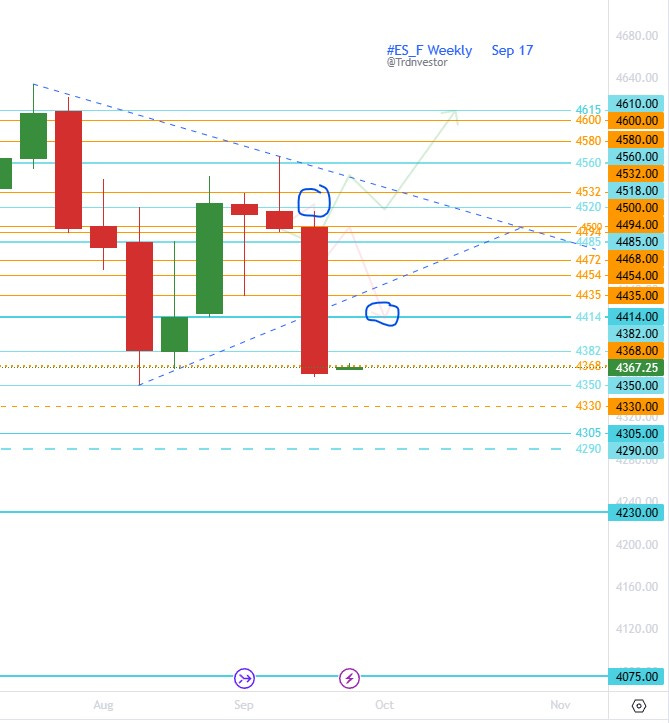
Last week, I initially maintained a bearish bias for #ES, #NQ, #YM, and #RUT. I pinpointed specific levels at which I anticipated potential bullish defense and where bears might regain control. Unsurprisingly, nearly all of these indices tested close to the initial levels where bearish pressure was expected, confirming that bears remained firmly in control.
For instance, for #ES_F, I highlighted levels such as 4518, 4530, and 4540 as points where bears might intervene. #ES bulls struggled to even reach 4518, managing only to touch 4514.5 before encountering swift bearish resistance.
Subsequently, each of the support levels I identified—4494, 4485, 4478, 4463, and 4454—played a pivotal role throughout the week, acting as significant barriers before the #ES_F took a sharp downturn, ultimately plummeting to the 4358 level by the end of the week.
Week Ahead (9/25 – 9/29)
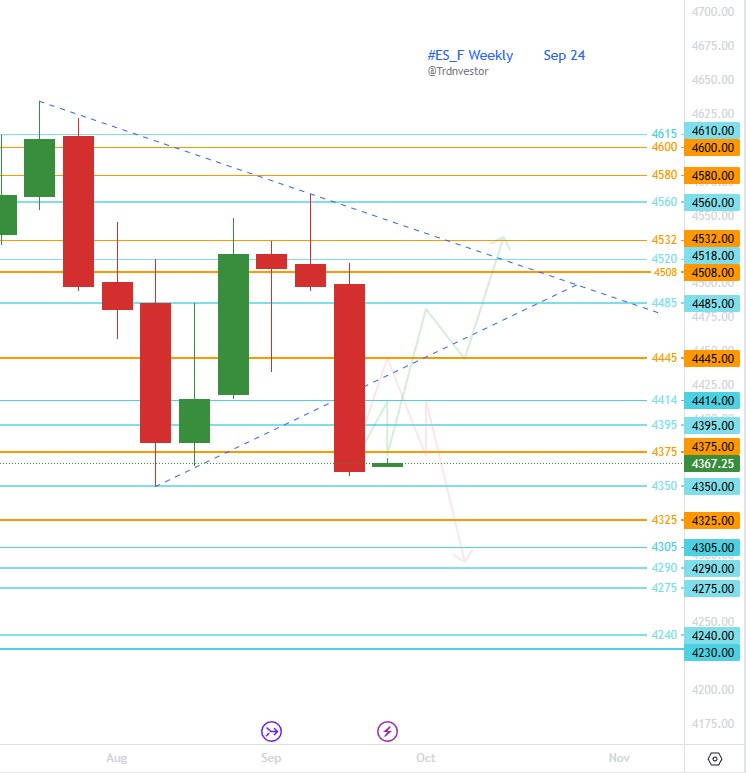
#ES_F / $SPX Futures: Bears step by step
Weekly: 🐻
Daily: cautious 🐻
Week closed strong red with Friday's close barely holding 4358 support.
Near key 4350 neckline support, hence cautious bearish on daily
If bulls have to step in even for relief bounce, time is now else 4305 in play
If 4350 fails, gap fill at 4305 from June 9 is more likely
4350 fails, 4325/4290 in play
Zoomed-out View: Until close above 4508 or at least 4450, assume bearish play continues
Key Levels:
🔑 resistance: 4375, 4395, 4445, 4485, 4508
🔑 support: 4458, 4450, 4325, 4290, 4275
Green Flags: Keep an eye out for potential signs of a bullish reversal on red days:
Lime Flag: A close above 4395 on green day may indicate that daily downtrend bias is in question
1st Green Flag: A close above 4450 on green day may suggest that the short term weekly downtrend bias is in question
2nd Green Flag: A close above 4508 on green day potentially short term downtrend bias is voided
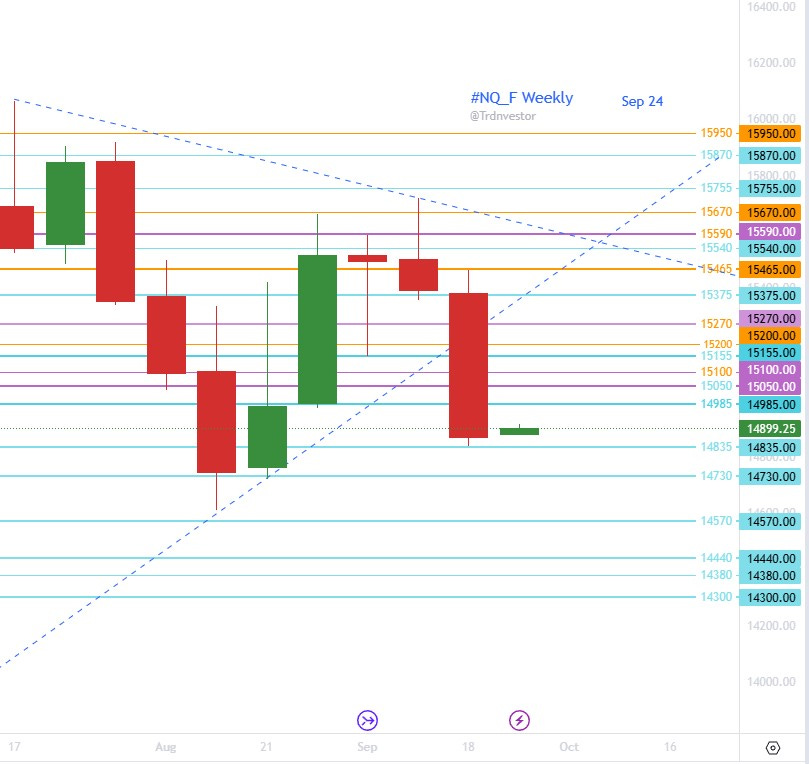
#NQ_F / #NDX Futures: Bears roaming
Weekly: cautious 🐻
Daily: 🐻
Week closed strong red with Friday's close barely holding 14835 support hence bearish bias
Likely to gap fill from June 9 around 14595/14565, where bulls may step in, it's cautious bearish
If 14835 fails, 14250 in play with 14565 support in between
In order to change to bullish bias on daily, either bulls need to hold 14835 & close green day above 15155 or bulls hold 14595/14565 & close green day above 14835
If so, would keep bulls on path to test 15465+
Zoomed-out View: Until close > 15465, or at least 15155, assume bearish play continues to 14250-
Key Levels:
🔑 resistance: 14925, 14985, 15050, 15155, 15375
🔑 support: 14835, 14730, 14570, 14440, 14300
Green Flags: Keep an eye out for potential signs of a bullish reversal on red days:
Lime Flag: A close above 14975 on green day may indicate that daily downtrend bias is in question
1st Green Flag: A close above 15155 on green day may suggest that the short term weekly downtrend bias is in question
2nd Green Flag: A close above 15465 on green day potentially short term downtrend bias is voided
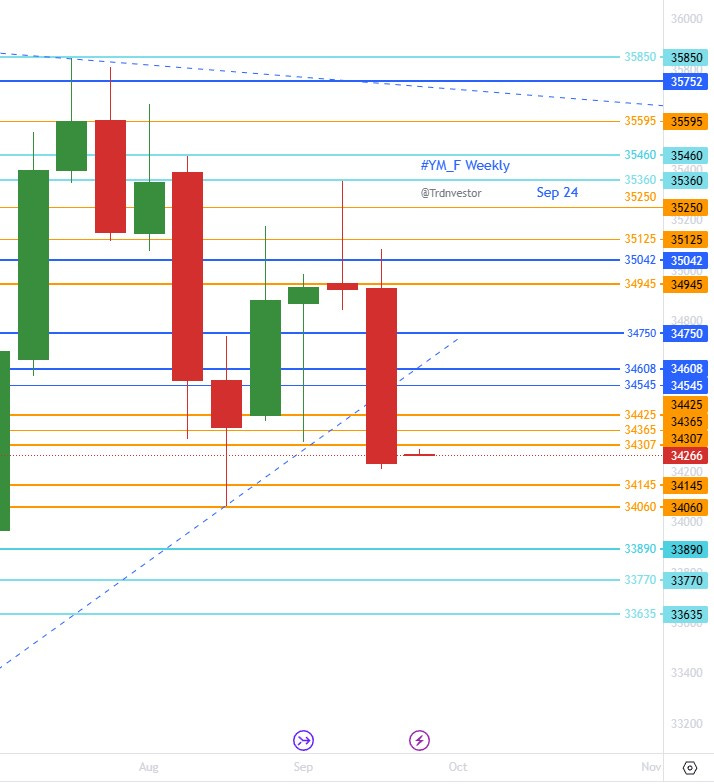
#YM_F / #DJI Futures: Still ways to go down?
Weekly: 🐻
Daily: 🐻
Strong red weekly candle & Friday's close below key 34307, keeps bearish bias
As long bears hold 34425, 33970 in play, 34145 & 34060 support en route
If 34870/34850 fails, 34709/34605 in play
34605 fails, 34470/34420 in play
Zoomed-out View: Until close > 34945, assume bearish play to continue
Key Levels:
🔑 resistance: 34307, 34425, 34608, 34750, 34945
🔑 support: 34145, 34060, 33890, 33770, 33635
Green Flags: Keep an eye out for potential signs of a bullish reversal on red days:
Lime Flag: A close above 34425 on green day may indicate that daily downtrend bias is in question
1st Green Flag: A close above 34750 on green day may suggest that the short term weekly downtrend bias is in question
2nd Green Flag: A close above 34945 on green day potentially short term downtrend bias is voided
#RTY_F / #RUT Futures: Bears jumped from one support to the next
Weekly: cautious 🐻
Daily: cautious 🐻
Weekly candle strong red with Friday closed below key 1798.5 support, keeps bias bearish
Oversold bounce from near 1790/1787.8 support may make it cautious
Below 1790, 1773 & 1751 in play
Zoomed-out View:
Same as last couple of weeks with bear/bulls level dropping further: Until green day close above 1872 or at least 1864, assume bearish play continues
Key Levels:
🔑 resistance: 1800, 1810, 1827, 1864, 1872
🔑 support: 1790, 1787.8, 1773, 1764, 1751
Green Flags: Keep an eye out for potential signs of a bullish reversal on red days:
Lime Flag: A close above 1810 on green day may indicate that daily downtrend bias is in question
1st Green Flag: A close above 1864 on green day may suggest that the short term weekly downtrend bias is in question
2nd Green Flag: A close above 1872 on green day potentially short term downtrend bias is voided
#DXY / $USD : Bulls still marching
Bullish streak continued for 10th straight week
Still no signs of cooling.
While the US Dollar Index (#DXY) closed the week strong & hit first of two targets from last week (105.7) but sign of rejection yet
If 105.30 or at last 105.050 continue to hold, 106.06 next
Red Flags: Keep an eye out for potential signs of a bearish reversal on red days:
Orange Flag: A close below 105.100 on a red day may indicate that the daily uptrend bias is in question.
1st Red Flag: If the market closes below 104.665 on a red day, it may suggest that the short-term weekly uptrend bias is in question.
2nd Red Flag: Significant concerns may arise if the market closes below 104.025 on a red day, potentially voiding the short-term weekly uptrend bias.
The choppy price action throughout August ultimately gave way to a downside resolution last week. Up until that point, my outlook had been leaning towards a bullish sentiment. However, the strong bearish close observed last week prompted me to reconsider my stance.
Nonetheless, there's a potential shift back to a bullish perspective if certain lime/green flags are triggered, as previously mentioned. Until I witness these flags in action, I am inclined to believe that the bears maintain control of the market.
Considering seasonality factors, it has been suggested that we might experience an upward movement from October to December. However, the crucial question remains: how much damage can the bears inflict before this potential upturn materializes?
In my view, this week plays a pivotal role in determining the answer to that question. In fact, the price action we observe on Sunday night could set the tone for the rest of the week.
Stay vigilant and adapt your trading strategies based on the changing market conditions and the key support and resistance levels outlined above. Keep a close watch on the flag levels as early indicators of potential shifts in bias.
If you aren’t already following me on X @trdnvestor , consider it for daily/intra day updates.
May you be on the right side of the market this week !
Disclaimer: This is NOT financial advice. I am NOT a financial advisor.


