
Weekly Reading for 9/18-9/22
Balancing Bearish Winds and Bullish Hopes

Quick look at last week:
Last week's market performance was a mixed bag. Initially, a bullish scenario unfolded as Monday saw #ES and #NQ close above key resistance levels, indicating the potential for further gains. However, the momentum waned, with Tuesday witnessing a swift reversal.
Wednesday tested critical support levels as identified in my weekly reading — 4494 for #ES, 15415 for #NQ, 34870 for #YM, and 1852 for #RTY—where bulls successfully defended, paving the way for a rebound towards respective resistance levels on Thursday—4560 for #ES, 15718 for #NQ, 35350 for #YM, and 1895 for #RTY. On Friday, fake breakout attempts gave way to a bearish close.
#DXY closed the week strong, nearing the anticipated level of 105.365, but a red close on Friday hinted at potential rejection. Interestingly, the inverse relationship between #DXY and equity markets was evident on Monday and possibly on Friday, but other days showed a more complex interplay.
During last week, traders faced a unique confluence of challenges. Due to futures rollover and expiration, many charts weren't updated correctly, making level analysis a complex endeavor. Coupled with this, the release of key economic indicators, including CPI, PPI, Unemployment, and Consumer Sentiments, introduced heightened volatility into the markets.
It was a demanding week for traders, whether they were bullish or bearish.
Week Ahead (9/18 – 9/22)
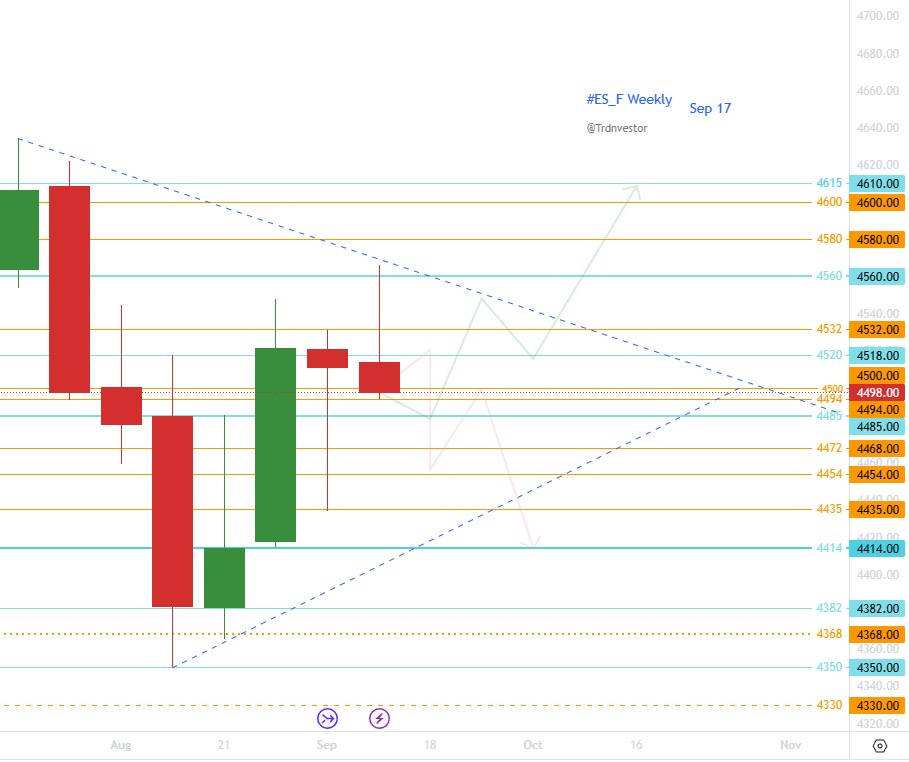
#ES_F / $SPX Futures: Bulls Shy at 4500, Bears Watching 4494
Current Sentiment: The weekly view for E-mini S&P 500 Futures (#ES_F) remains cautious bearish. The cautious bearish sentiment on both weekly and daily charts is evident in last week's red close, highlighted by a strong bearish red candle on Friday. Key support levels at 4500/4494 were in focus, and although Friday's close slipped below 4500, it managed to hold above 4494. This cautious bearish bias is attributed to the inability to close convincingly above 4500
.
Bullish Defense: As mentioned on Friday, 4540 was key level for the bulls to defend. Therefore, if Sunday night maintains support at 4494, bears may find opportunities to enter at 4518, 4530, and ultimately 4540. It would be crucial for bulls to reclaim 4540 and, more importantly, stay above 4530 to establish a bullish confirmation.
Bearish Pressure: Bearish pressure will persist until a day closes above 4566 or, at the very least, 4548.
Bearish Scenario: In case the 4494 support fails, the market could target a gap fill at 4463 from September 8, followed by 4454. Further downside potential could bring the levels around 4420/4382 into play.
Change to Bullish Bias: In following scenarios bias may change to bullish if bulls:
Hold 4494 and close the day with a green candle above 4532.
Maintain 4463/4454 and close the day with a green candle above 4478.
Keep 4435/4420 and close the day with a green candle above 4454.
Zoomed-out View: If bulls manage to hold 4494 and successfully reclaim 4532, it could set the stage for potential targets at 4615 and even 4740.
Key Levels:
🔑 Resistance: 4518, 4530, 4560, 4600, 4615
🔑 Support: 4494, 4485, 4478, 4463, 4454
Red Flags: Keep an eye out for potential signs of a bearish reversal on red days:
Orange Flag: A close below 4490 signifies that the daily uptrend bias is in question.
1st Red Flag: A close below 4454 suggests that the short-term weekly uptrend bias is in question.
2nd Red Flag: If the close falls below 4433, it indicates that the short-term weekly uptrend bias has been voided.
#NQ_F / #NDX Futures: Navigating the Bear's Den
Current Sentiment: The weekly outlook for E-mini Nasdaq 100 Futures (#NQ_F) remains cautious bearish, mirroring the cautious sentiment observed on the daily chart. The week concluded with a bearish tone as Friday's close slipped below the critical 15415 support level, reinforcing the bearish bias.
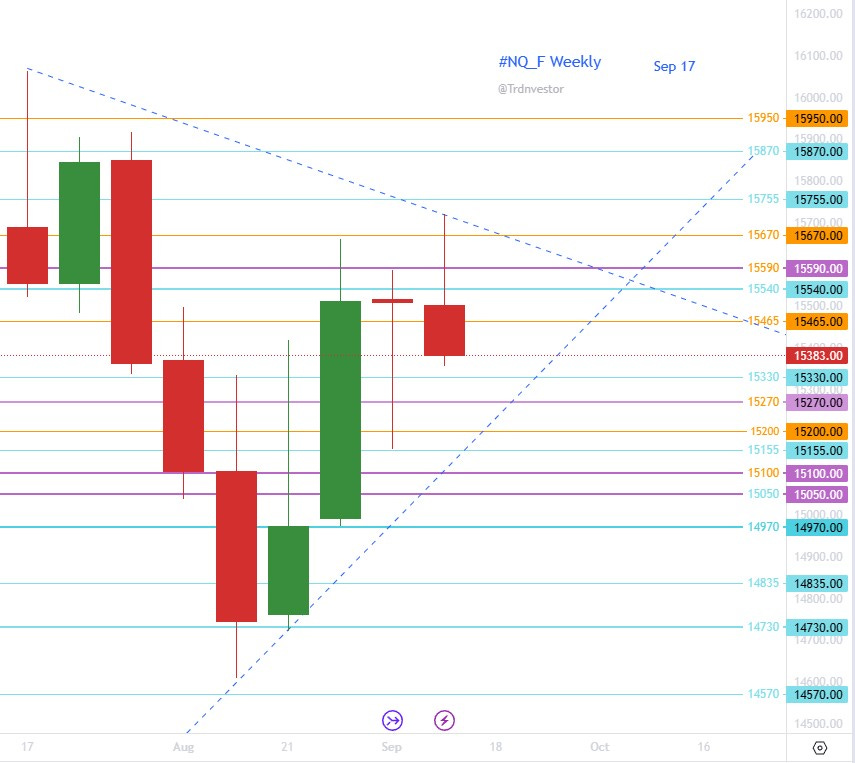
Bullish Defense: Given the potential for a test of the gap fill from September 8 around 15330/15270, where bullish support might emerge, a cautious bearish stance is warranted.
Bearish Scenario: If 15270 fails to hold, the market could target 15100/15050 as the next support levels.
Change to Bullish Bias: In following scenarios bias may change to bullish if bulls:
hold 15270 & close green day above 15540/15465
hold 15100/15050 & close green day above 15400/15270
Zoomed-out View: Should bulls successfully maintain the 15100/15050 support and close a green day above 15590, the possibility of revisiting all-time highs (ATH) comes back into focus.
Key Levels:
🔑 Resistance: 15465, 15540*, 15670*, 15755, 15810*
🔑 Support: 15330, 15270*, 15200, 15100*, 15050*
Red Flags: Keep an eye out for potential signs of a bearish reversal on red days:
Orange Flag: Caution should be exercised until a close above 15720 or at least 15670 is achieved.
1st Red Flag: A close below 15270 suggests that the short-term weekly uptrend bias is in question.
2nd Red Flag: A close below 15050 indicates that the short-term weekly uptrend bias has been voided.
#YM_F / #DJI Futures: Bearish But There’s Some Hope for Bulls
Current Sentiment: The weekly outlook for Dow Jones Industrial Average Futures (#YM_F) maintains a cautious bearish stance, aligning with the cautious sentiment observed on the daily chart. The week ended with a notable reversal, erasing all gains from the initial four days.
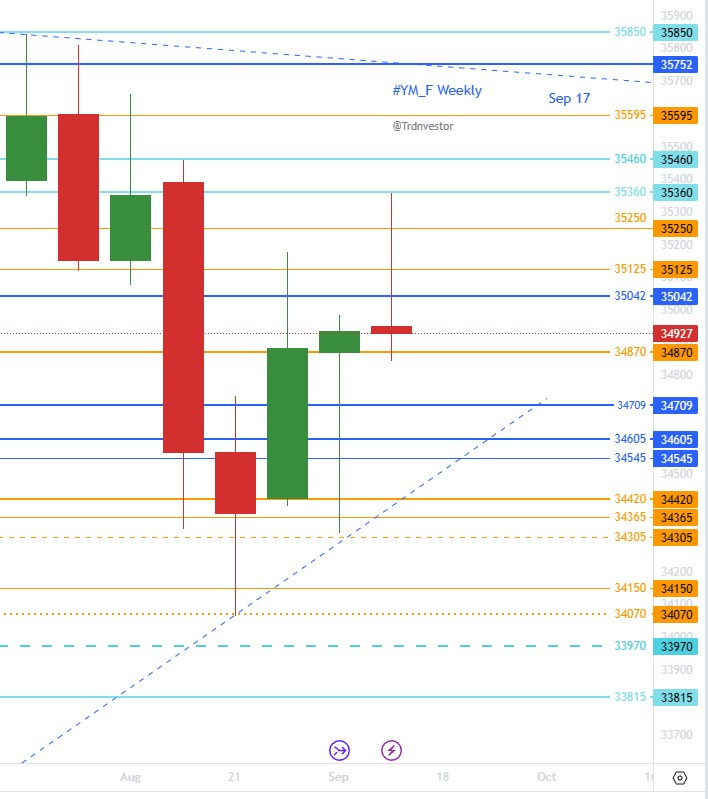
Bullish Confirmation: Despite Friday's sharp decline, there remains a glimmer of hope for the bulls as the market held above 34870 and closed higher than 34915. To achieve bullish confirmation, bulls should maintain the 34900 level, promptly secure 35042, and close with a green day above 35125, or at least above 35042.
Bearish Scenario: If 34870/34850 support falters, the market may target 34709/34605. If these levels are breached, further downside pressure could lead to 34470/34420.
Zoomed-out View: A bullish scenario could come into play if bulls effectively hold 34709/34605 and reclaim 35190, potentially paving the way for a move towards 35700.
Key Levels:
🔑 Resistance: 35042, 35125*, 35250, 35360*, 35460*
🔑 Support: 34870/34850, 34709, 34605*, 34500, 34420*
Red Flags: Keep an eye out for potential signs of a bearish reversal on red days:
Orange Flag: Caution is advised until a close above 35042 is achieved.
1st Red Flag: A close below 34870 would suggest that the short-term weekly uptrend bias is in question.
2nd Red Flag: A close below 34500 would indicate that the short-term weekly uptrend bias has been voided.
#RTY_F / #RUT Futures: Russell's Reluctant Bears
Current Sentiment: The cautious bearish sentiment is observed on weekly and daily chart for Russell 2000 Index Futures (#RTY_F). Although the week concluded with a solid red close, it marked a shift from the more pronounced bearish trend observed the previous week.
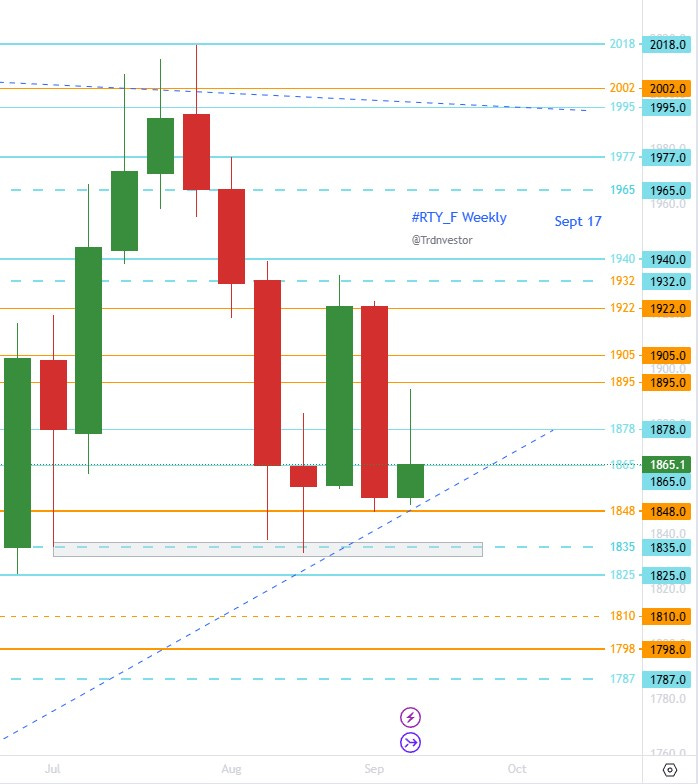
Bullish Scenario: To establish a bullish stance, it's crucial for bulls to retain control by holding the 1860/1857 support range and successfully reclaiming 1882. Closing the day in green above this level may set the stage for a potential move to 1905.
Bearish Pressure: While Friday held the 1857 support, bearish pressure persists until the market manages to close the day above 1925. However, bearish sentiment may begin to ease with a close above 1882.
Bearish Scenario: In the event bears maintain control and keep the market below 1878 or 1882, while subsequently reclaiming 1860, the market may test lower levels around 1848/1835. Further downside pressure could lead to 1835, and if this level fails to hold, 1798 may come into play.
Zoomed-out View: Until there is a green day close above 1925, or at least 1905, a cautious bearish approach is recommended. The market's direction may become clearer based on its ability to navigate the specified support and resistance levels.
Key Levels:
🔑 Resistance: 1872, 1878, 1882*, 1892, 1915*
🔑 Support: 1860*, 1848*, 1835*, 1825, 1810
Green Flags: Keep an eye out for potential signs of a bullish reversal on green days:
Lime Flag: A close above 1882 on a green day could indicate that the daily downtrend bias is in question.
1st Green Flag: Further confirmation of a bullish trend is signaled by a close above 1915. It may suggest that the short-term weekly downtrend bias is in question.
2nd Green Flag: A strong bullish sentiment would be established with a close above 1925, potentially voiding the short-term weekly downtrend bias.
#DXY / $USD : Weekly bulls maintain their grip
Current Sentiment: The US Dollar Index (#DXY) exhibited a remarkable bullish streak for the ninth consecutive week. The bullish momentum remained robust with no immediate signs of cooling. The week concluded on a strong note, bringing the index closer to the anticipated level of 105.365. However, a red close on Friday hinted at a potential, albeit weak, rejection.

Bullish Scenario: To strengthen the bullish outlook, it is vital for the US Dollar Index to sustain levels above 105.125 or, ideally, 104.560. Achieving this would potentially open the path to 105.7 and 106.06.
Red Flags: Keep an eye out for potential signs of a bearish reversal on red days:
Orange Flag: A close below 104.560 on a red day may indicate that the daily uptrend bias is in question.
1st Red Flag: If the market closes below 104.025 on a red day, it may suggest that the short-term weekly uptrend bias is in question.
2nd Red Flag: Significant concerns may arise if the market closes below 103.010 on a red day, potentially voiding the short-term weekly uptrend bias.

As observed on the zoomed-out line chart, the US Dollar ($USD) is nearing the upper boundary of a downward channel, may suggest the possibility of a temporary pullback soon or will it?
Over the past few weeks, the market has displayed choppy behavior. Typically, such volatility eventually gives way to a more prominent trend. In these conditions, the key to success is agility, patience, and good risk management. While my current inclination is toward a bullish trend, I'm using my flag system as a compass. I'm committed to remaining flexible and will swiftly adjust my stance if my system indicates a shift. Remember, there's no merit in clinging to a bias that isn't proving fruitful.
Stay vigilant and adapt your trading strategies based on the changing market conditions and the key support and resistance levels outlined above. Keep a close watch on the flag levels as early indicators of potential shifts in bias.
If you aren’t already following me on X @trdnvestor , consider it for daily/intra day updates.
Have a happy trading week!
Disclaimer: This is NOT financial advice. I am NOT a financial advisor.