Weekly Reading for 9/11 - 9/15
Are Falling Leaves Making Bulls Cautiously Dance?
Quick look at last week:
Last week, my cautious bullish outlook quickly turned red for all four index futures: #ES, #NQ, #YM, and #RUT. Despite initial optimism, I needed confirmation for my bullish bias, especially at #ES's critical 4532 level. Bulls pushed it to 4531.25, but bears took over.
Then my bearish scenarios played out well. Especially in #ES. When 4508 gave way, 4472 came into play, and if 4472 faltered, it was 4445 or 4435. It felt like the market followed my script.
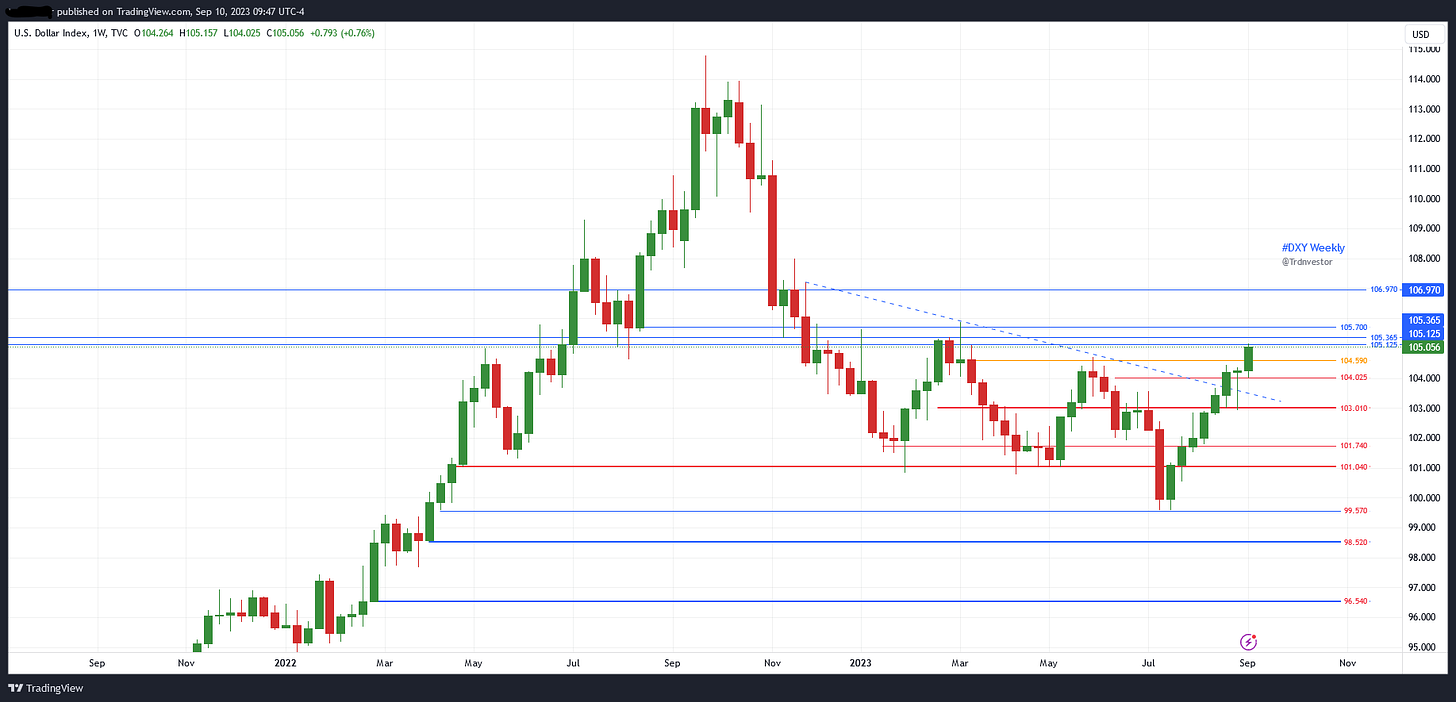
For real-time insights, follow my daily posts on X @trdnvestor. Additionally, #DXY stayed bullish for an eighth week, closing with another strong green candle.
In hindsight, my reading worked well, despite the initial bullish bias. My flag system again identified precise bias-changing moments, guiding trading effectively.
In addition, #NQ_F needed bullish confirmation at 15560, briefly reaching it but then turning bearish at 15585. #YM_F aimed for 34975 but stalled at 34969! Waiting for confirmation spared me from stubbornly sticking to a bullish bias.
Note about Contract Rollover: It's essential to consider that futures are rolling over on Sunday/Monday, and the charts for continuous contracts are yet to be updated correctly. This may slightly complicate level analysis, and adjustments may be required once updated charts are available on Monday.
Week Ahead (9/11 – 9/15)
#ES_F / $SPX Futures: Cautious Bullishness Prevails
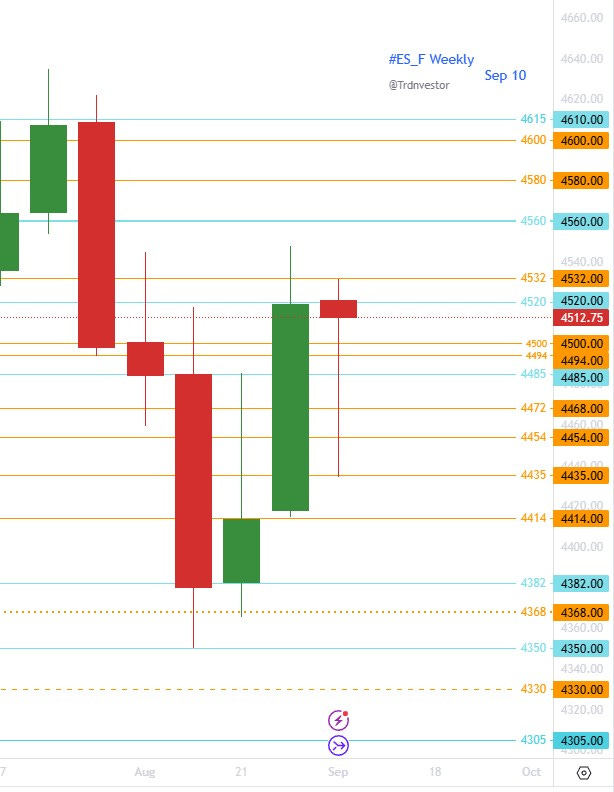
Current Sentiment: The weekly and daily outlook for E-mini S&P 500 Futures (#ES_F) maintains a cautious bullish stance. Despite a red week, Friday's closing showed some resilience with a modest green finish.
Key Support Holds: Notably, during this red week, Thursday and Friday held the crucial 4435 support, signaling potential strength in this range.
Bullish Scenario: For the bulls to confirm this, holding above 4500 and swiftly reclaiming 4520 would be significant steps. This could pave the way for further bullish momentum.
Bearish Pressure: It's important to recognize that until a daily close above 4532 is achieved, bearish pressure may persist.
Support and Targets: As long as 4500/4494 holds, the target range around 4615 remains in play. However, if 4490 fails, the market could aim for 4454, and a further failure at 4454 might bring 4435/4414 into focus.
Zoomed-out View: In a broader perspective, the outlook remains unchanged from last week: If the bulls can secure the 4485/4472 range and successfully reclaim 4532, it may set the stage for a substantial move towards 4740.
Key Levels:
Resistance: 4532, 4560, 4580, 4600, and 4615
Support: 4500/4494, 4485, 4472, 4454, 4435, and 4414
Red Flags: Keep an eye out for potential signs of a bearish reversal on red days:
Orange Flag: A close below 4490 on a red day may signal that the daily uptrend bias is in question.
1st Red Flag: If the market closes below 4454 on a red day, it suggests that the short-term weekly uptrend bias is in question.
2nd Red Flag: Significant concerns may arise if the market closes below 4414 on a red day, potentially voiding the short-term weekly uptrend bias.
#NQ_F / #NDX Futures: Cautiously Bullish Across Timeframes
Current Sentiment: The weekly outlook for E-mini Nasdaq 100 Futures (#NQ_F) maintains a cautious bullish sentiment, which is echoed on the daily chart. While the week closed in red, Friday's closing showed a modest green finish.
Weekly Support and Bias: It's noteworthy that during the previous week, the bulls successfully defended the 15155 support level, which tilts the bias in their favor.
Bullish Confirmation: To see a confirmation of this bias, it is imperative for the bulls to maintain levels around 15455 and promptly reclaim 15560. Achieving this could keep the bulls on track to test 15870 or higher.
Bearish Pressure: It's important to acknowledge that until a daily close above 15590 is achieved, bearish pressure may persist.
Support and Potential Targets: As long as the market holds above 15455/15415, the potential target remains at 15590. However, if 15415 fails, the market could explore levels around 15340 or even 15100.
Zoomed-out View: In a broader perspective, the bullish scenario remains intact: If the bulls can hold the 15455/15415 range and successfully reclaim 15590, it could potentially pave the way for a return to all-time highs.
Key Levels:
Resistance: 15560, 15615, 15755, 15870, and 15950.
Support: 15455, 15415, 15340, 15050, and 14970
Red Flags: It's crucial to remain vigilant for potential signs of a bearish reversal on red days:
Orange Flag: A close below 15415 on a red day may signal that the daily uptrend bias is in question.
1st Red Flag: If the market closes below 15355 on a red day, it suggests that the short-term weekly uptrend bias is in question.
2nd Red Flag: Significant concerns may arise if the market closes below 14970 on a red day, potentially voiding the short-term weekly uptrend bias.
#YM_F / #DJI Futures: Weekly-Daily, Cautious Bull
Current Sentiment: The outlook for Dow Jones Industrial Average Futures (#YM_F) is characterized by a cautiously bullish sentiment on the weekly chart and a similarly cautious sentiment on the daily chart.
Here are the key observations:
Weekly Support and Rollover: The market demonstrated strength by holding the 34305 support level and closing above the box. It's important to note that due to futures contract rollover, the week appears to be closing in the green on the chart.
Bullish Scenario: To maintain and build on the current bullish momentum, it's essential for the bulls to hold levels around 34870/34790 and successfully reclaim 34975. In such a scenario, a back test of 35395 or higher comes into play.
Potential Bearish Scenarios: Conversely, if 34755 fails to hold, the market may explore levels around 34685/34620. Further downside could be anticipated if 34620 fails, potentially leading to levels around 34470/34420.
Zoomed-out View: For a broader perspective, if the bulls can maintain control around 34790/34755 and successfully reclaim 34975, it could pave the way for a potential move towards 35595.
Key Levels:
Resistance: 34975, 35190, 35395, 35415, and 35595.
Support: 34870, 34790/34755, 34620, 34525, and 34420.
Red Flags: Keep an eye out for potential signs of a bearish reversal on red days:
Orange Flag: Until there's a close above 34975, consider the market to be under Orange flag advisory.
1st Red Flag: A close below 34755 on a red day may suggest that the short-term weekly uptrend bias is in question.
2nd Red Flag: If the market closes below 34400 on a red day, indicating potential voiding of the short-term weekly downtrend bias.
#RTY_F / #RUT Futures: Reverting to Cautious Bearish. Once More?
Current Sentiment: The weekly outlook for Russell 2000 Index Futures (#RTY_F) indicates a cautious bearish sentiment, in line with the daily sentiment. Despite a brief bullish move during the week of August 28, the market swiftly reverted to a bearish tone last week.
Bearish Pressure: Bearish pressure persists unless the market can achieve a daily close above 1925. However, there's potential for this pressure to begin easing after a daily close above 1878.
Bullish Scenario: If the levels around 1852/1848 hold and 1878 is reclaimed, it could open the door for a move towards 1905.
Bearish Scenario: Should the bears maintain control by holding 1878 or 1865 and subsequently reclaim 1952, the market could test 1835.
Further Downside: If 1848 fails to hold, the next level to watch is 1835, and a breach of this could bring 1798 into play.
Zoomed-out View: In a broader context, it's prudent to assume a bearish stance until the market can either reclaim 1925 or at least 1905.
Key Levels:
Resistance: 1865, 1878, 1895, 1905, and 1922.
Support: 1848, 1835, 1825, 1810, and 1798.
Green Flags: Keep an eye out for potential signs of a bullish reversal on green days:
Lime Flag: A close above 1878 on a green day could indicate that the daily downtrend bias is in question.
1st Green Flag: If the market closes above 1905 on a green day, it may suggest that the short-term weekly downtrend bias is in question.
2nd Green Flag: A significant bullish confirmation could occur if the market closes above 1925 on a green day, potentially voiding the short-term weekly downtrend bias.
#DXY / $USD : Bulls, Like the Energizer Bunny, Just Keep Going
Current Sentiment: The US Dollar Index Futures (#DXY $USD) have been on a relentless bullish streak, extending for the 8th consecutive week. There are still no clear signs of a cooling-off period in sight. Reminds me of July 2014-March2015 run.
Bullish Momentum: The relentless bullish momentum has defied expectations of a pullback for the past three weeks. Instead, flag levels have been identified to serve as early warnings of any potential changes in bias.
Key Resistance Level: A significant level to watch is if the weekly close surpasses 105.365, which could signal a potential move towards 106.970.
Red Flags: Keep an eye out for potential signs of a bearish reversal on red days:
Orange Flag: A close below 104.590 on a red day may indicate that the daily uptrend bias is in question.
1st Red Flag: If the market closes below 104.025 on a red day, it may suggest that the short-term weekly uptrend bias is in question.
2nd Red Flag: Significant concerns may arise if the market closes below 103.010 on a red day, potentially voiding the short-term weekly uptrend bias.
Impact on Equities: It's noteworthy that the strength in the US dollar ($USD) appears to be inversely affecting equity markets, particularly #NQ and #ES, at least for the time being.
Stay vigilant and adapt your trading strategies based on the evolving market conditions and the key support and resistance levels outlined above. Keep a close watch on the flag levels as early indicators of potential shifts in bias. If you aren’t already following me on X @trdnvestor , consider it for daily/intra day updates.
Have a great trading week!
Disclaimer: This is NOT financial advice. I am NOT a financial advisor.


