Weekly Reading for 10/16-10/20
and the plot thickens...
Quick look at last week:
Last week, the level-to-level bullish scenarios worked exceptionally well in several cases. For instance, in the case of #ES, the expectation was for 4305 to hold, and it indeed brought the market to 4385, resulting in an 80-point move. It even reached the second target of 4400. However, the move from the second target (4400) to the third (4448) didn't materialize as expected, reversing early at 4430.
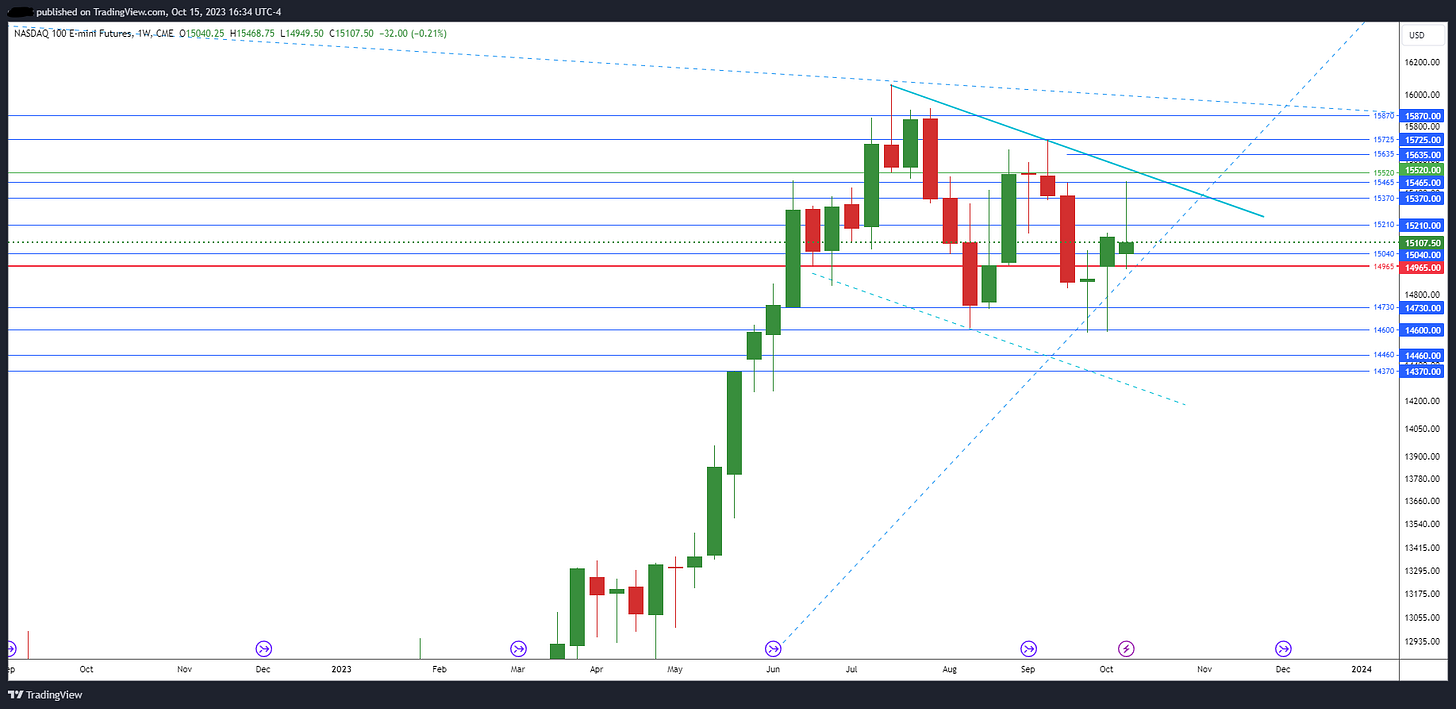
Similarly, in the case of #NQ, the market reached 15150 and 15375 as projected but reversed precisely at the key resistance level of 15465, even though the third target was set at 15520.
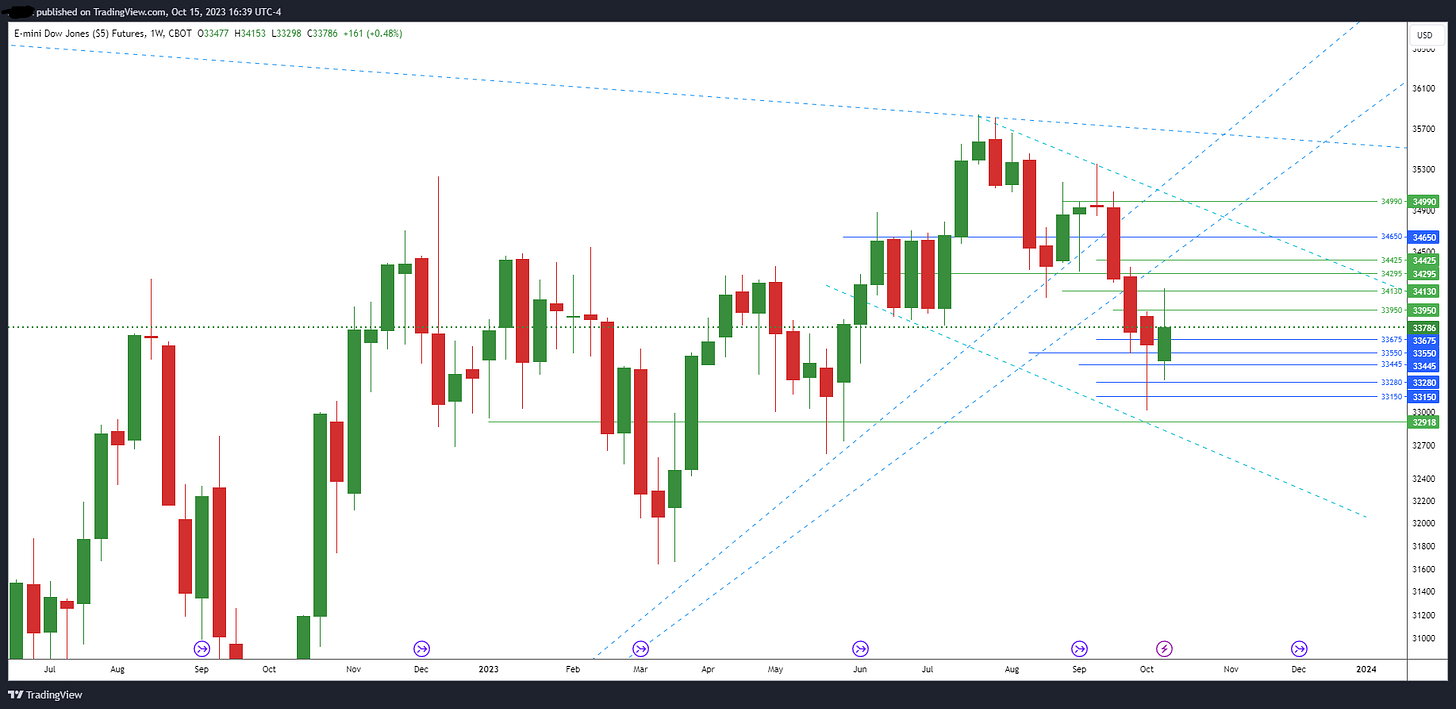
For #YM, it held the critical level of 33280 on Monday and closed the week in a bullish tone, going on to fulfill two out of three level-by-level bullish plays.
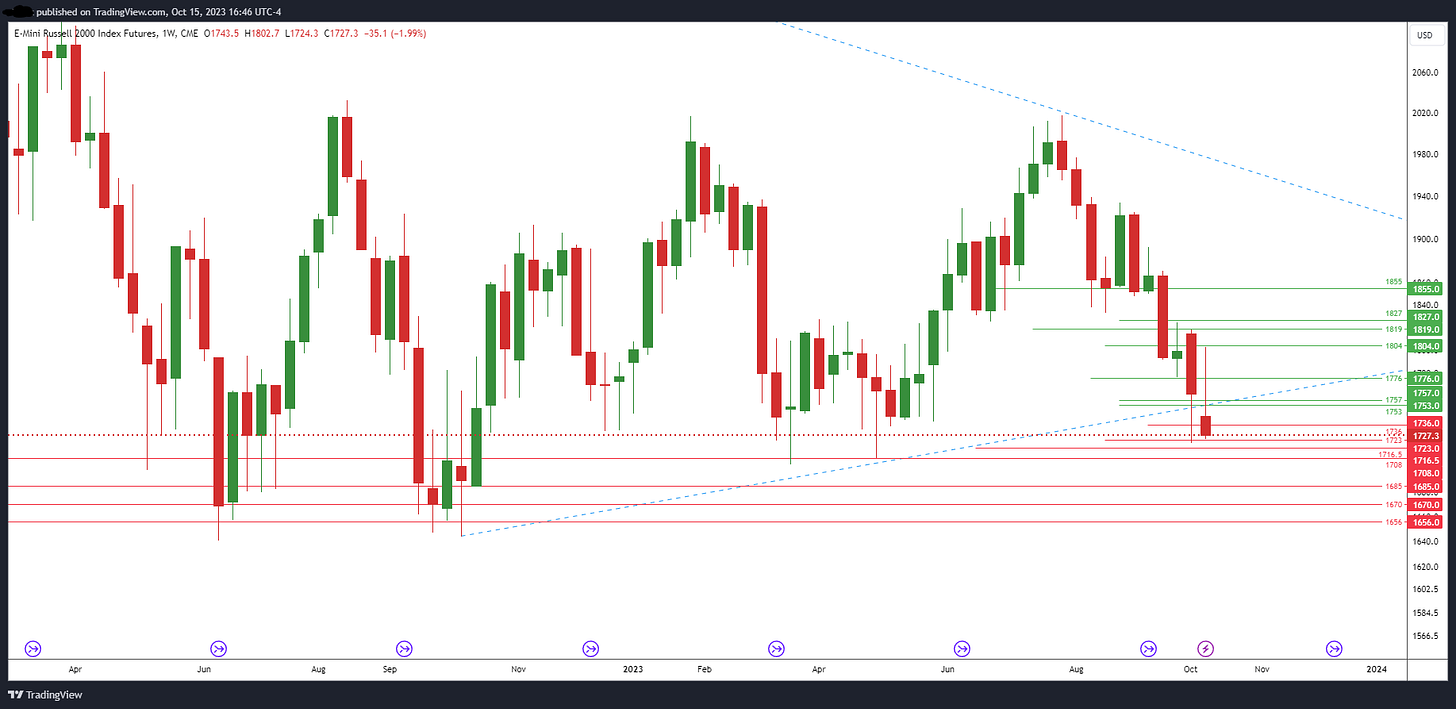
Conversely, #RTY's bullish play didn't unfold as anticipated. While it did manage to reclaim 1752 and reach 1776, it failed to progress to the next upside target, reversing quickly.
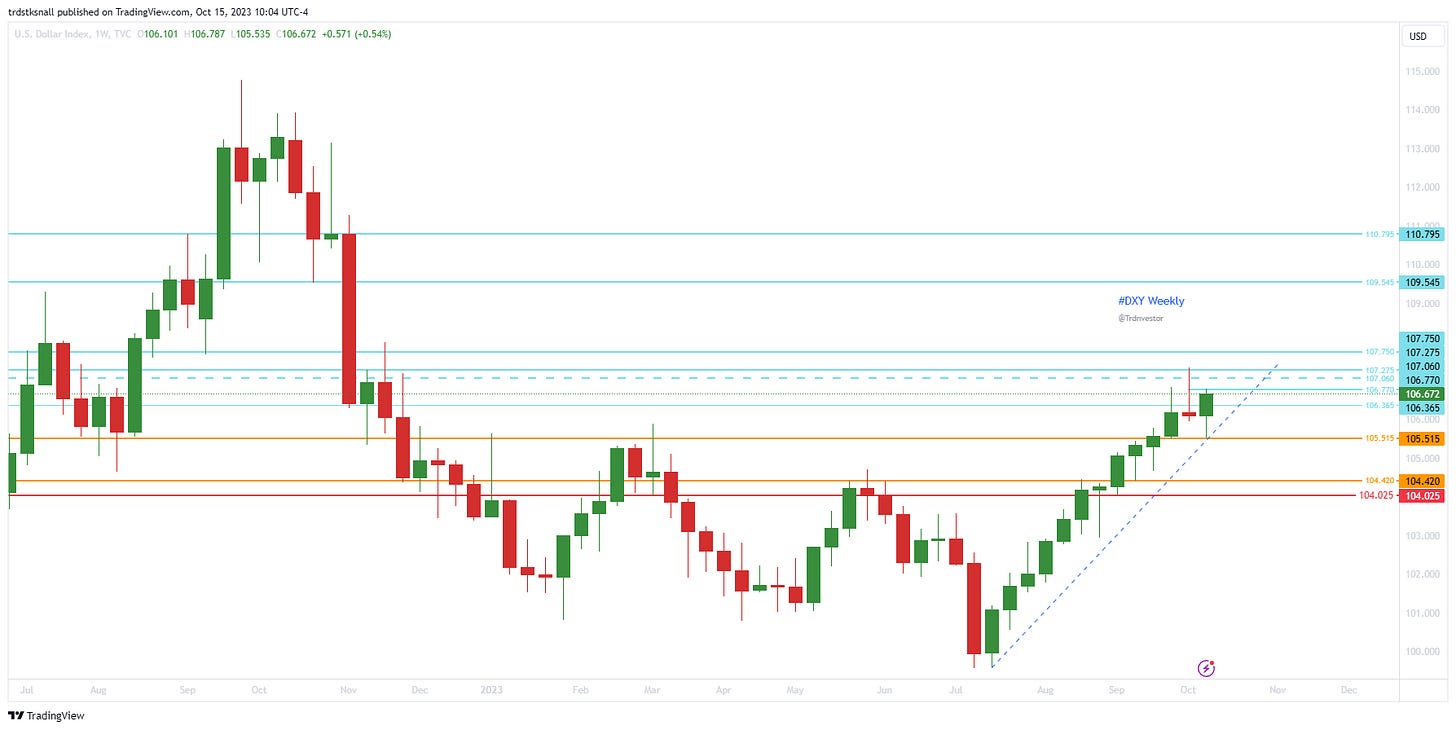
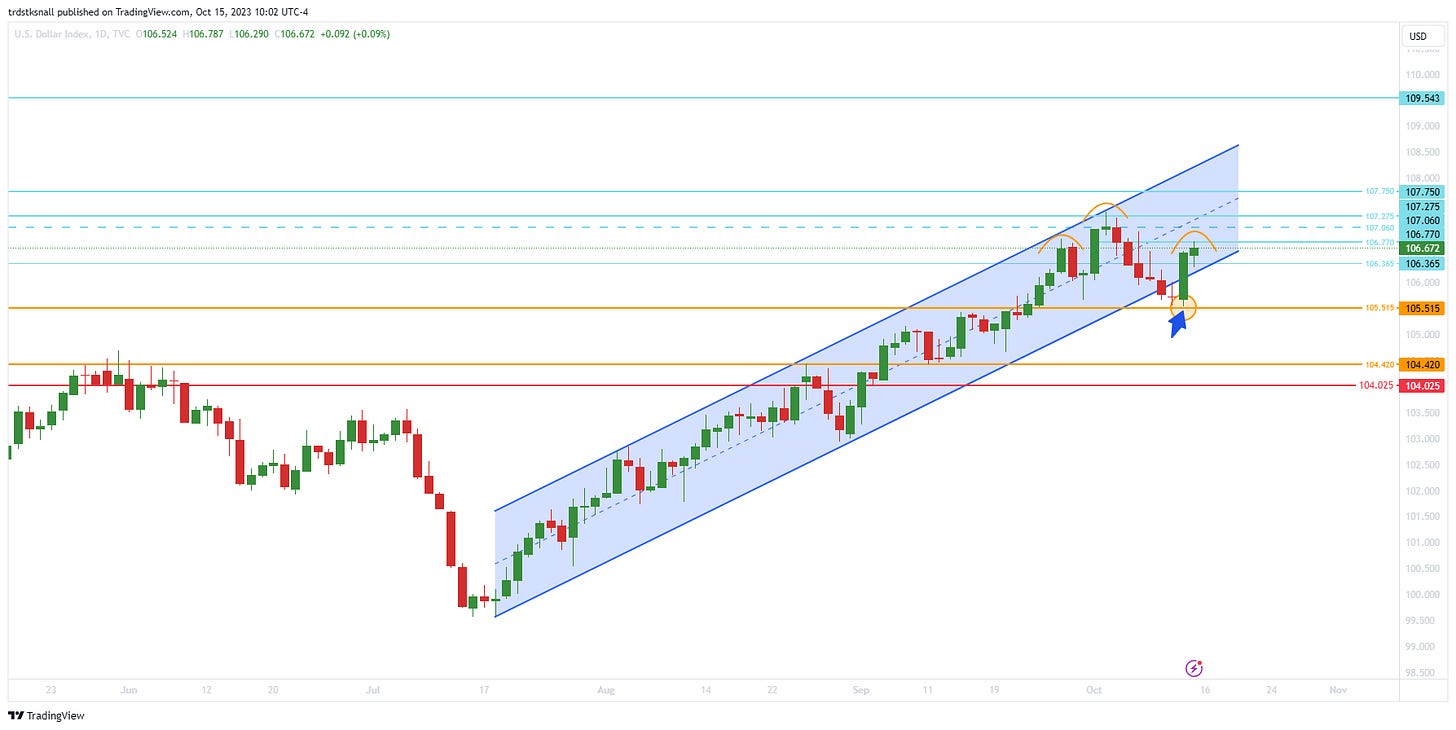
As for #DXY, it followed expectations consistently up to the orange flag level at 105.515, but a sudden bullish surge reversed the trend at 105.535, ending the week on a positive note.
Overall, it was a week of successful bullish & later bearish trades for #ES, #NQ, #YM, and #DXY, while #RTY continued to present challenges for trading.
Week Ahead (10/16 – 10/20)
After Thursday's close, the sentiment on Fintwit is pretty divided. Many are confident that the market is poised to hit new lows this week. Beyond that, there's an almost equal split between those who believe this marks the bottom, and the market will start to recover from here, and those who are fearful of a potential market crash, similar to what happened in 1987 or 2008.
While my track record in reading the market has been fairly accurate most of the time (check out the "Quick look at last week" section in the previous weekly newsletter), it's important to remember that I'm no fortune teller. My approach is to observe and react to what the charts reveal as each day unfolds, keeping a close eye on key levels and flags.
In addition to broader macroeconomic factors and geopolitical tensions, there are three key factors working against the bulls in the upcoming week. First, the strength of #DXY/USD is exerting pressure. Second, the Russell 2000 index is showing signs of weakness. Lastly, the market will have to contend with a slew of speeches from FOMC members, which can introduce additional uncertainty.
Events Calendar for next week :
#ES_F / $SPX Futures: Cautious Bulls look weak
📈 Weekly: Conditional 🐂 📊 Daily: Cautious 🐻
Analysis:
In the previous week, the market exhibited strong bullish momentum, achieving targets of 4385 and 4400 before almost reaching the third target of 4448 (with a high of 4430.5) and subsequently experiencing a notable pullback.
A bearish sentiment prevails on the daily chart, primarily due to the compelling red move observed on Thursday and Friday. However, it is worth noting that as long as the critical level of 4315 remains intact, there is still room for cautious optimism, thereby warranting a conditional bullish outlook for the week.
It's essential to highlight the ongoing weekly pattern of lower lows and lower highs, as identified that 4500 may well be the next prospective lower high.
But now, a question arises from the price action witnessed on Thursday and Friday: Is the market already hinting at the establishment of a lower low at 4430?
A pragmatic view suggests that bullish hopes persist as long as the levels of 4335, or at least 4315, are maintained and the market can successfully close above 4410.
However, the week is marked by a degree of uncertainty, compounded by a series of FOMC member speeches and the unsettling breakdown in the Russell 2000.
Monthly Viewpoint:
🐻 Bearish Goal: 4190
🐂 Bullish Goal: 4515
Weekly Perspective:
🐻 Bearish: In the event of a daily breach below 4315, potential targets to the downside include 4220 and 4190.
🐂 Bullish: If bulls hold levels of 4335, or at the very least, 4315, as support, there is an opportunity for a move towards 4500, with intermediate resistance seen at 4385 and 4430.
Level by Level Bullish Play (on Daily):
If the support at 4315 holds, the potential for an advance towards 4400 becomes viable.
Upon successfully claiming the 4410 level, the next target on the radar is 4448.
Should the market attain a close above 4448, the focus then shifts to the significant milestone of 4500.
Level by Level Bearish Play (on Daily):
A breach below 4315 could prompt a bearish move towards 4285.
If 4285 fails to hold, the next support zone to consider includes 4230 and 4220.
Subsequently, should 4220 give way, 4190 emerges as the subsequent downside target.
Zoomed-out View:
The broader perspective maintains a focus on the 4500 level as a viable target, contingent upon the successful preservation of the 4335/4315 support zone, albeit with a degree of fragility.
Key Levels:
Resistance: 4366, 4385, 4400, 4432, 4448
Support: 4335, 4315, 4285, 4235/4220, 4190
Possible Trade Plans:
Considering the aforementioned analysis and key levels, here are some potential trade plans:
Long Trade:
If the market opens lower and hasn't reached 4272 yet, look for signs of 4320/4315 holding on smaller timeframes, particularly after a brief drop below 4315 (potentially to 4305/4300) followed by a rapid recovery. This presents an opportunity to go long with a stop loss just below 4300 and an initial target of 4366, with a secondary target at 4372. This trade carries an estimated risk of 20 points for a potential profit of 50 points.
Short Trades:
If the price moves downwards to 4285, retraces upwards to 4305, and subsequently rejects this level, consider a short position at 4285. Place the stop loss just above 4305 and target 4335 as the initial goal, with 4190 as the next target. This trade entails an approximate 25-point stop loss for a potential 50-point profit on the initial target.
If the market has not yet reached 4285 and bears reject the 4366/4372 level, assess the setup at that point and consider a short position with a stop loss just above 4372 and a target of 4285.
It is essential to note that these risk-to-reward calculations are approximations and subject to variation based on actual entry and market conditions.
Green Flags: Should the market experience a green day, watch for the following bullish reversal signals:
Lime Flag: A close above 4336 on a green day. (Triggered)
1st Green Flag: Attaining a close above 4410 on a green day could potentially challenge the short-term weekly downtrend bias.
2nd Green Flag: A significant bullish confirmation may transpire if the market closes above 4448 on a green day, potentially negating the short-term weekly downtrend bias.
#NQ_F / #NDX Futures: Is it consolidating or ready to breakdown?
📈 Weekly: Conditional 🐂 📊 Daily: Cautious 🐻
Analysis:
In the preceding week, the market successfully reached its bullish targets. However, the strong red moves observed on Thursday and Friday have shifted the bias towards a cautious bearish sentiment on the daily chart.
As long as the key level of 14965 remains intact, there are still glimmers of hope for the bulls. However, should this level fail to hold, it could open the door to a potential new lower low in the market.
Monthly Viewpoint:
🐻 Bearish Target: 14290
🐂 Bullish Targets: 15520 / 15725
Weekly Perspective:
🐂 Bullish: If the levels of 15040/14965 hold as support, the market has the potential to target 15375/15460.
🐻 Bearish: Should 14965 fail to hold, the market could target 14720/14560.
Level by Level Bullish Play (on Daily):
If 14965 holds, there's potential for an advance towards 15210.
Once the level of 15210 is claimed, the next target becomes 15370.
Subsequently, if 15370 is claimed, the focus shifts to the target of 15520.
Level by Level Bearish Play (on Daily):
In the event that 14965 fails, the market may head towards 14720.
Should 14720 fail to hold, the next support zone to consider includes 14600.
If 14600 gives way, 14460 comes into focus.
Zoomed-out View:
The broader perspective maintains a focus on the level of 15040 or, at the very least, 14965 as a pivotal support, with the aim of reaching 15500.
Key Levels:
Resistance: 15210, 15370, 15465, 15520, 15635
Support: 15040, 14965, 14720, 14600, 14460
Green Flags:
Should the market experience a green day, watch for the following bullish reversal signals:
Lime Flag: A close above 14950 on a green day. (Triggered)
1st Green Flag: Achieving a close above 15150 on a green day may warrant a reconsideration of the short-term bearish bias.
2nd Green Flag: A significant bullish confirmation could transpire if the market closes above 15465 on a green day, potentially negating the short-term bearish outlook.
#YM_F / #DJI Futures: Last chance for bullish to keep in play
📈 Weekly: Conditional 🐂 📊 Daily: Cautious 🐻
Analysis:
Despite experiencing a significant red flush on Thursday and Friday, last week concluded with a green close, which has helped maintain some degree of bullish optimism in the market.
Notably, Monday demonstrated resilience as it held the level of 33280 and closed above 33710, effectively altering the weekly bias to a bullish one. This bullish sentiment persisted until Wednesday.
The current bullish bias is contingent on the critical level of 33380 remaining intact.
It's worth mentioning that the first green flag, which was triggered on Wednesday, was subsequently negated by the closing action on Thursday.
As previously noted last week, the bull's strength remains questionable as long as the market remains below 34425.
Monthly Viewpoint:
🐻 Bearish Target: 32910
🐂 Bullish Targets: 34650 / 34800
Weekly Perspective:
🐂 Bullish: If the level of 33380 holds as support, the market has the potential to target 34425.
🐻 Bearish: In the event that 33280 fails to hold, potential downside targets include 33150 and 32910.
Level by Level Bullish Play (on Daily):
If the levels of 33750/33675 remain as support, the market can advance towards 33950.
Once 33950 is claimed, the next target is 34060.
Subsequently, if 34060 is achieved, the focus shifts to the target of 34295.
Level by Level Bearish Play (on Daily):
Should 33750 fail to hold, the market could gravitate towards 33550.
If 33550 fails to hold, the next support level to consider is 33380.
A breach below 33380 could bring 33280 into focus as the next potential support.
Zoomed-out View:
Until a close above 34425 materializes, it is prudent to assume that the bearish play is likely to continue.
Key Levels:
Resistance: 33950, 34060, 34130, 34295, 34425
Support: 33675, 33550, 33445, 33380, 33280
Green Flags: If the market experiences a green day, observe for the following bullish reversal signals:
Lime Flag: A close above 33710 on a green day. (Triggered)
1st Green Flag: Achieving a close above 34130 on a green day may necessitate a reconsideration of the short-term bearish bias.
2nd Green Flag: A significant bullish confirmation may transpire if the market closes above 34425 on a green day, potentially challenging the short-term bearish outlook.
#RTY_F / #RUT Futures: Eagerly waiting for some bounce
📈 Weekly: Cautious 🐻 📊 Daily: Cautious 🐻
Analysis:
The market experienced its lowest weekly close in the past 52 weeks, which indicates a considerable bearish sentiment.
The recent week presented an opportunity for the bulls, but their chance slipped away, especially on Thursday and Friday.
However, there's a silver lining as the market is still managing to hold the crucial support at 1723 from the week before last. This level stands as a line in the sand for the bulls, although their position remains relatively weak.
The key concern is that if the support at 1723 fails to hold, it could pave the way for a deeper downside move, making it essential to preserve the formation of a weekly lower low.
Caution is warranted because the market is hovering near multi-month support levels. Nonetheless, the bears still exert influence below 1804.
Monthly Viewpoint:
🐻 Bearish Target: 1752 (already achieved)
🐂 Bullish Targets: 1865/1905
Weekly Perspective:
🐂 Bullish: If the support at 1723 holds, the market has the potential to target 1757/1769.
🐻 Bearish: If 1723 fails, the downside targets include 1685/1663.
Level by Level Bullish Play (on Daily):
If the support at 1723 holds, there's potential for an advance towards 1753.
Once 1757 is claimed, the next target becomes 1769.
Subsequently, if 1769 is achieved, the focus shifts to the target of 1800.
Level by Level Bearish Play (on Daily):
In the event that 1723 fails to hold, the market may gravitate towards 1708.
Should 1708 fail to hold, the next support level to consider is 1685.
A breach below 1685 could bring 1667/1656 into focus.
Zoomed-out View:
Until the market achieves a green day close above 1827, or at least 1804, it is advisable to assume that bearish pressure will continue to dominate.
Key Levels:
Resistance: 1753, 1757, 1776, 1804, 1819
Support: 1723, 1716.5, 1708, 1701, 1685
Green Flags: If the market experiences a green day, watch for the following bullish reversal signals:
Lime Flag: A close above 1757 on a green day.
1st Green Flag: Achieving a close above 1804 on a green day may necessitate a reconsideration of the short-term bearish bias.
2nd Green Flag: A significant bullish confirmation may transpire if the market closes above 1827 on a green day, potentially challenging the short-term bearish outlook.
#DXY / $USD : Do bulls need more rest or last week was enough?
📈 Weekly: Cautious🐂 📊 Daily: Cautious🐂
Analysis:
The bulls in the market needed just a week and a few days of rest, and they came back strong, particularly on Thursday. Notably, they returned precisely from the level of 105.515, which was identified as a critical Orange Flag threshold. Closing below this level would have cast the first sign of an upward trend in doubt.
The resurgence of the bulls brought #DXY back within the upward channel.
There are two potential levels, 106.770 and 107.060, where bears may still have an opportunity to intervene. If they fail to do so, the path to 107.275 and a new 52-week high could open up. More upside levels are identified on the charts above.
The strength in the USD is significantly influencing weakness in equities.
Red Flags: Keep an eye out for potential signs of a bearish reversal on red days:
Since market has returned within a strong channel, we'll maintain the same flag levels as last week.
Orange Flag: Until there's a close below 105.515, consider the market to be under orange flag advisory.
1st Red Flag: A close below 104.420 on a red day may suggest that the short-term weekly uptrend bias is in question.
2nd Red Flag: If the market closes below 104.025 on a red day, indicating potential voiding of the short-term weekly downtrend bias.
Note about Terminology:
In my weekly reports and X (Twitter) posts, I often refer to terms like "must hold," "claim," or "fail." Here's a quick explanation of what these terms mean:
For intraday analysis: I consider the 15-minute or 1-hour candle close.
For trades spanning overnight to two days: I focus on the 4-hour candle close.
For a weekly or longer-term outlook: I rely on the daily candle close.
close above: claimed / close below: failed
These references are also available in the pinned thread on my X profile (Twitter) . I strongly recommend reading that thread for a deeper understanding of my chart analysis. While I plan to elaborate on my methodology in a separate Substack post in the future, the pinned thread on my X profile offers valuable insights for now.
Stay vigilant and adapt your trading strategies based on the changing market conditions and the key support and resistance levels outlined above. Keep a close watch on the flag levels as early indicators of potential shifts in bias. If you aren’t already following me on X @trdnvestor , consider it for daily/intra day updates.
Wish you the peace and happiness !
Disclaimer: This is NOT financial advice. I am NOT a financial advisor.


