Weekly Reading 8/28/2023 - 9/1/2023
#ES_F / $SPX Futures: Cautious Optimism
Last week's market activity in #ES futures provided insights that hint at cautious optimism. Let's break down the key observations and their implications for the market.
Cautious Bullish Sentiment
The sentiment in both the weekly and daily analyses of #ES_F can be summarized as the positive outlook, albeit with a touch of prudence.
4350 Support Holds Steady
For last two weeks 4350 level held good. This consistent backing is a significant indicator of market strength, suggesting that buyers are actively preventing a substantial downturn.
Mixed Signals from Bullish Close
Despite the overall bullish sentiment, the week's closing lacked the resounding confirmation. I was looking for close above 4425 for confirmation, specially after back testing 4485.
Key Levels and Possible Trajectories
The significance of the 4400 and 4395 levels cannot be overlooked. Sustaining these levels might pave the way for optimistic trends. Conversely, a breach of the 4370 level might usher in a downward shift, targeting 4350 or even 4305.
In bearish scenario, if bears hold key levels like 4417 or 4428 & close red day below 4380, or hold 4470 or 4485 & close below 4428, especially on a red day, could signal a shift towards bearish sentiment.
The Bigger Picture
As long as the weekly close remains below 4508 to 4500, there's room for bears to exert influence or for the market to consolidate. Reclaiming 4485 in the weekly close, however, could set the stage for an optimistic push towards 4610.
Resistance and Support
4417, 4470, 4485, and 4508 are key resistance, and 4400, 4395, 4368, and 4350 are key support levels—offer essential reference points for decision-making.
Trade Plan
Should the support at 4406/4400 hold and the range of 4418 to 4428 be reclaimed, this might unlock a pathway towards 4470/4485.
On other hand if 4370 fails to hold, 4350 and 4305 comes into play.
In summary, the #ES_F futures last week displayed a cautiously bullish trend. Keeping a finger on the pulse of short-term movements while staying attuned to broader trends remains a prudent approach in navigating the dynamic market condition.
#NQ_F / #NDX Futures: Cautious Bullish
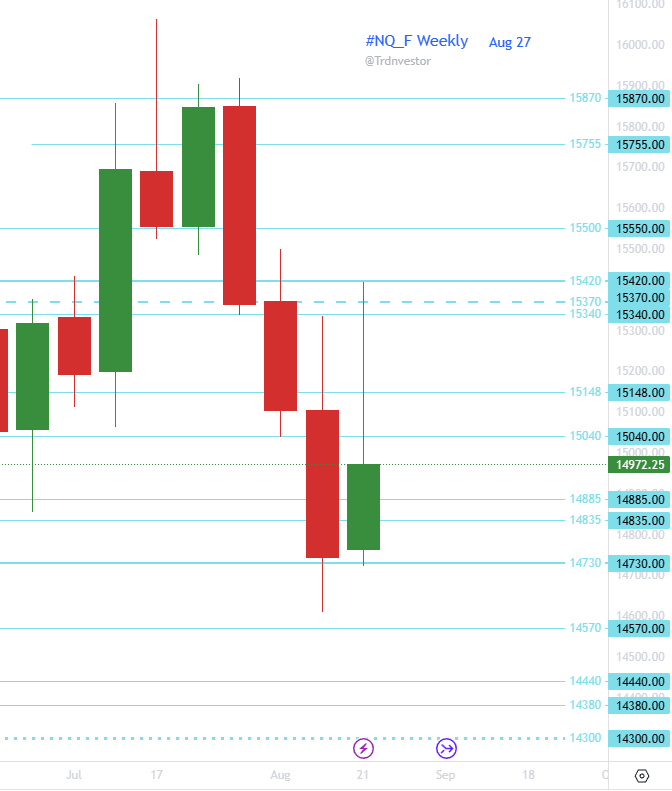
Looking at #NQ_F chart it's evident that caution prevails across both weekly and daily views.
The 14730 support remains steadfast, underscoring the market's resilience despite an uncertain bullish close. Amid this landscape, the 14835 level holds significance – a gatekeeper that, if holds, could potentially lead to a bullish push towards 15330+.
However, a reversal at 14835 could trigger a downward move, targeting 14730 or even 14380. Bearish prospects hinge on specific levels maintained alongside red day closures. These include if bears hold 15040 or 15148 & close below14815 OR hold 15330 or 15420 & close below 15105.
Zooming out, the broader perspective unveils intriguing possibilities. As long as the weekly close lingers below 15340, bears maintain the chance to drive a downward trend or sustain a sideways movement.
For actionable plan, focus turns to the possibility of bulls holding 14885/14835 and reclaiming 15040. This maneuver could potentially set the stage for a move towards 15370+.
In this landscape, key resistance levels at 15040, 15148, 15330, 15370, and 15420 play a vital role, as do critical support levels at 14885, 14835, 14730, 14570, 14380, and 14300.
#YM_F / #DJI Futures: Balancing Sentiments
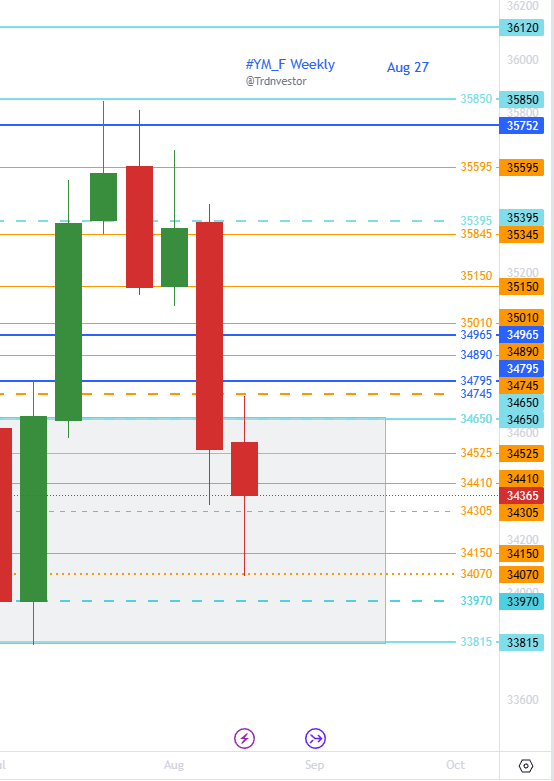
In the world of #YM_F, caution rules both weekly and daily viewpoints. The bullish weekly and bearish daily encapsulate the sentiments, reflecting a delicate interplay.
The support at 34070 stands strong, a critical anchor amidst the dynamics. However, a shift demands a green day closure > 34745 or at least 34650. Without it, the bear pressure persists, possibly aiming for 33970/33910.
Notable support lies at 34150 and 34070, shaping the path ahead.
A ray of hope emerges if bulls secure 34305 and reclaim 34525. This could set the stage for a back test of 34890/35010 (about 580/700 points play).
#RTY_F / #RUT Futures: A Dual Perspective
The dual perspective emerges through cautious bullish and bearish sentiments for #RTY_F.
At the heart of it lies the key level of 1851/1848, holding potential significance. Reclaiming 1866 could pave the way for 1878/1890, highlighting critical resistance levels at 1878, 1889, 1932, 1940, and 1965.
In contrast, if 1848 falters, the focus shifts to a potential move towards 1835/1825. These levels form crucial support, guiding the market's trajectory.
As we navigate this week, the bear pressure looms, only to be relieved with a week's close exceeding 1890.
#DXY / $USD : Trend Reaching Local Top?
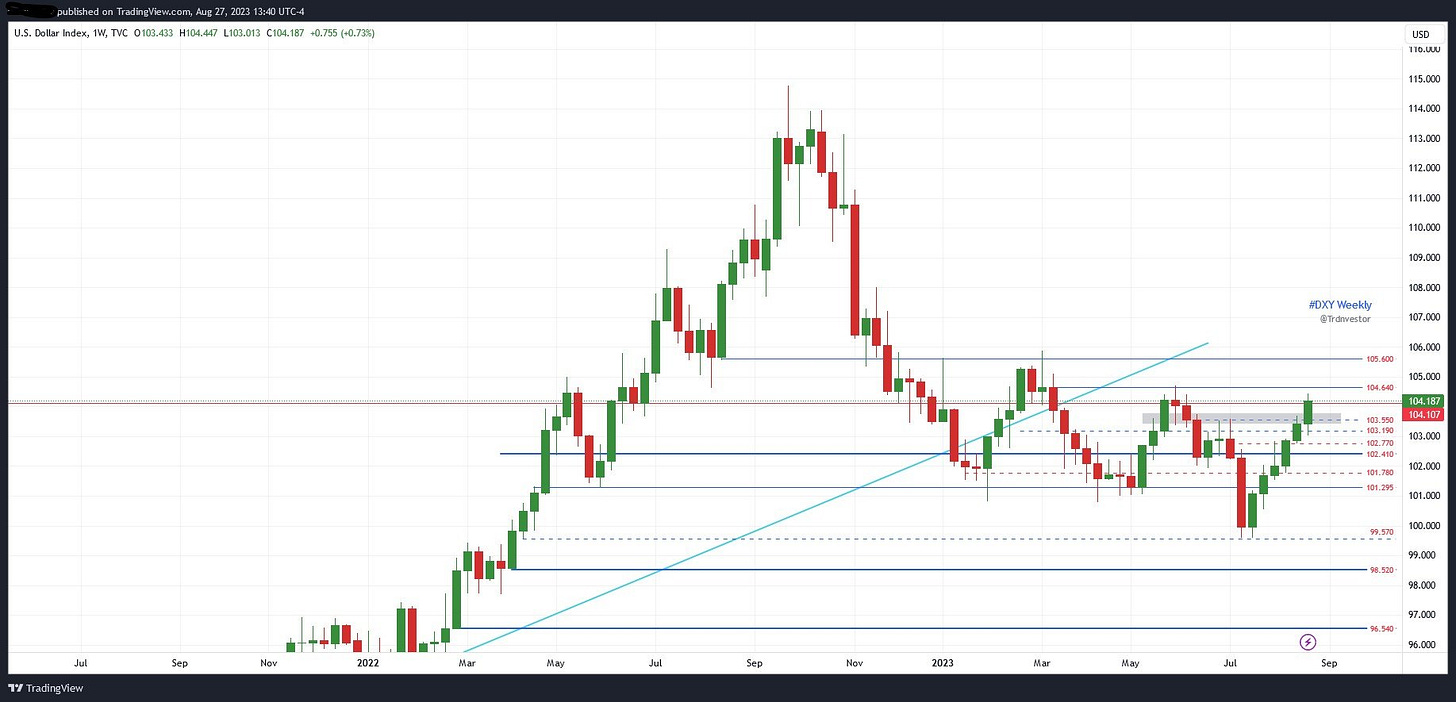
Turning our attention to #DXY and $USD, a striking trend emerges as we observe six consecutive weeks of green. Yet, as we approach the formidable resistance zone of approximately 104.500 to 104.640, a potential pullback seems plausible—an expectation that has lingered for the past two weeks.
The allure of this resistance is not to be underestimated, offering a compelling juncture for market movements. This projection aligns well with the cautious bullish optimism for #ES_F, #NQ_F, #YM_F and #RUT.
However, a significant shift rests on the week's closure, where the red hue takes precedence. Until a weekly close below 102.770 manifests, the prevailing trend remains unscathed.
A threshold is set at a red day close below 103.190—a potential trigger for change.


