
Weekly Charts Reading for 7/22- 7/26
Bears Payday or Bulls?

Thanks to everyone who clicks 'Like', 'Repost', or 'Restack' this newsletter.
Your encouragement means a lot and keeps me motivated!
Given the abundance of numbers in this newsletter, there's a chance I might make a typo. If you spot any errors, please give me a heads up. Thanks a bunch!
How’s last week?
#ES_F
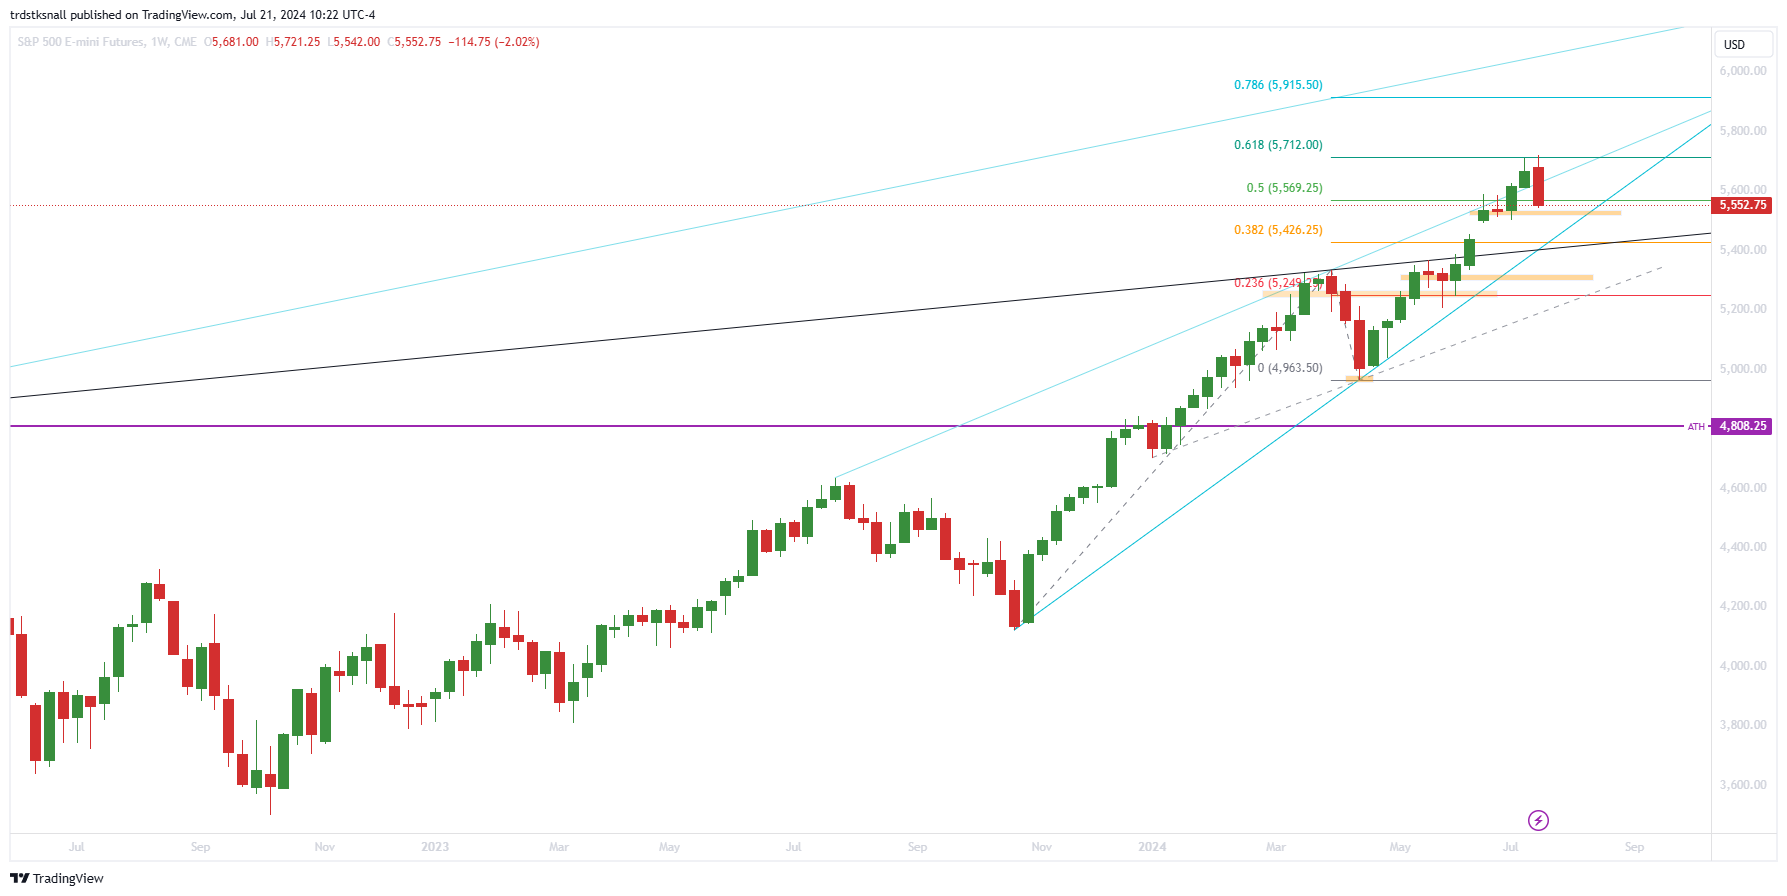
Made another ATH early on Tuesday at 5721.25, hitting almost 5722, one of the weekly targets
Failed to hold 5660 & 5656 weekly support from last week before Wednesday open
Continued slide down with a brief back test of 5660 (5664 high) on Thursday early hours
Bears had control and ended the week in strong red, first time since April
Although #ES held better than #NQ initially, by Thursday it was ready to give in more
#NQ_F
Last week, bulls needed to claim 20735 to show commitment to move up
Monday high was 20797 but couldn't close above 20735, leading to a slide from Tuesday onward hitting key 19700 support (19654 low)
On the way down, gave a few opportunities for short term long plays as mentioned in last week's plan
Provided two-way trading opportunities for active traders
Week ended closing strong in red near key support
#RTY
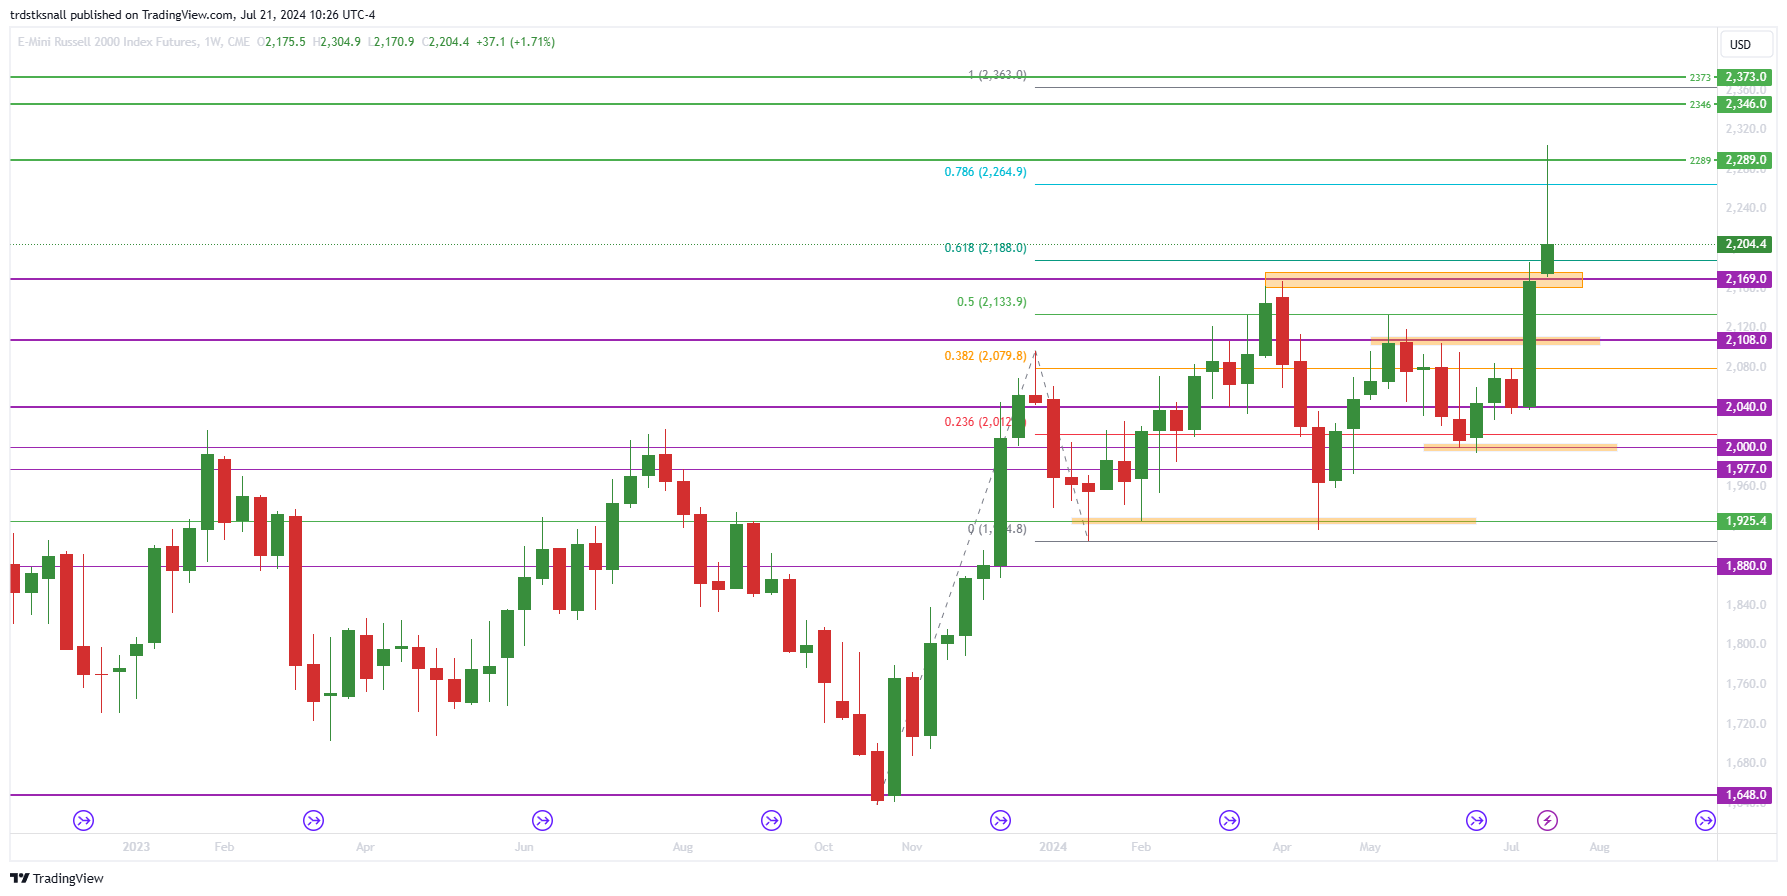
As expected, the bullish move continued and hit the last monthly target of 2300 on Wednesday but quickly pulled back
Closed the week near key weekly support levels
#YM
After claiming 40K week before last, bulls continued their march and made a new ATH at 41672 on Thursday
Pulled back sharply from there till end of Friday
#DXY
Bears closed below key 103.880 level on Tuesday but bulls stepped back in and closed the week in green
Market provided good bi-directional trading opportunities for active traders
Read here how I use this Weekly Newsletter in my daily trading
Disclaimer: This is NOT financial advice. I am NOT a financial advisor.
Quick update: It seems reaching 500 subscribers might take a bit longer than I hoped. But I'm not giving up just yet. I'll keep publishing, though I might take more breaks along the way. 😀
Big thanks to all of you who've been cheering me on. Your support means a lot!
Thanks, all!
Week Ahead (7/22 – 7/26)
No economic reports or major earnings due on Monday, so if #ES & #NQ bulls want to complete their back test moves, Sunday/Monday would be ideal.
However, this doesn't guarantee it will happen this way.
If Friday's bearish pressure continues on Sunday/Monday, earnings/economic reports starting Tuesday might push the market up to back test levels.
Both scenarios are equally likely. We'll know more by Sunday night.
If Sunday night holds the immediate support levels identified below and claims immediate key resistance, the market will likely move up to back test levels. Otherwise, it may go down and delay any back test bounce.
#NQ, #ES, and #RTY have printed lower highs and lower lows on the 4-hour chart since last Wednesday, with #YM getting there. To see a trend change, look for higher lows and higher highs on the 4-hour chart first.
If prices consolidate under immediate key resistance levels (Friday's highs), the price action is likely to continue downward.
Expect solid bi-directional trading opportunities this week.
Bears are in control for now. Bulls need to claim the levels identified in the respective sections to prove their intentions and commitment. Until that happens, consider all long plays short-term and take profits level to level.
Quick summary:
#ES: As long as 5545 holds or is reclaimed, 5558/60*/69*/5605/08+ in play; if 5545 fails, 5532*/23/11- in play.
#NQ: As long as 19700 or 19670 holds or is reclaimed, 19730/785*/835/945/980*+ in play; if 19670 fails, 19625/550/500/250*- in play.
#RTY: As long as 2201/2197 holds or is reclaimed, 2210/2222/25+ in play; if 2197 fails, 2194/83/75/67- in play.
#YM: As long as 40530/470 holds or is reclaimed, 40665/775/900+ in play; if 40470 fails, 40430/365/280/155- in play.
#DXY: Closed Wednesday below 103.880 support, but quickly reclaimed it on Thursday, showing bulls are coming back. For #DXY to continue downward, 104.440, 104.545, and 104.895 are key resistances where bears must step in; otherwise, bulls regain control.
Note about levels above ATH
Upside targets are estimated without left-side confirmation on the chart, utilizing a combination of Fibonacci and trend lines across multiple time frames. Feel free to reach out if these levels prove effective; otherwise, your understanding is appreciated.
These levels are subject to refinement as prices evolve throughout the days.
In the event of new highs, prioritizing profit-taking based on risk-to-reward multiples is recommended, rather than waiting for specific target levels to be reached.
Feel free to scroll down to the end of the report to get a rundown on some of the terms I'm throwing around, like "hold," "claim," and “fail”
Events Calendar:
Next week's calendar is packed with economic reports, but the market will likely focus on big tech earnings, bringing more volatility. Key tech names like TSLA, GOOG, MSFT, META, NVDA, AAPL, and AMZN are reporting earnings from Tuesday through Thursday.

#ES_F / $SPX Futures:
📈 Weekly: caution 🐻 📊 Daily: caution 🐂
Analysis:
Strong red weekly close with 3 red days in a row
Changing weekly and daily bias to bearish
First red flag triggered, but still holding above 5500 (second red flag level), adding caution to bearish bias
If 5569 is claimed by bulls and 5560 holds on pullback, a few green days could follow
Bears defending 5605/5616 keeps 5532/5500- in play
A red day close below 5500 triggers the second red flag, opening up 5435/15, 5350, 5300- in play
Claiming 5569 strengthens the bullish move but may still just be back testing 5605/16 or 5644/64
If bulls claim 5615, bears start feeling weak but are still interested
Claiming 5664 would flush most bears from last week's move down and bring a new ATH into focus
Bears must defend 5602/16 and 5655-5664 in case of higher back test rallies
Failed breakouts around these levels are likely short plays for bears
Downside
Key Support Levels: 5545, 5536/32, 5500/5435, 5350/35
Upside
Key Resistance Levels: 5560/69, 5605/16*, 5655, 5664/68
Ideally, bears defend 5560/69 or at least 5605/16 to prevent higher back test pain
Above 5669, bulls keep hope
Below 5645, bears keep momentum
Bears are clearly in control for now. Bulls need to claim the identified levels to prove their intentions and commitment. Until then, consider all long plays short-term and take profits level to level.
Yearly View:
🐂 Bullish: As long 4420/4350 holds 5615/6110+ in focus (first target hit Jul 5th)
🐻 Bearish: Monthly trend will dictate the bearish stance.
Monthly Viewpoint:
🐂 Bullish: as long 5435 or at last 5380 holds/reclaimed, 5705/5800 in play (first monthly target of 5705 hit)
🐻 Bearish: will determine when weekly trend turns bearish
Weekly Perspective:
🐂 Bullish: If 5545 holds & 5569 claimed, 5593/5602-05*/5616*/5635/38*+ in play
🐻 Bearish: As long bears hold 5560 or 5569 or 5545 fails, 5532*/11*/5500*/5435*- in play.
Level by Level Bullish Play (on Daily):
If 5569 claimed, 5578/5602*/08/16* in play
If 5616 claimed, 5630/5635/38* next
If 5638 claimed, 5655/5662/64/68* in play
If 5668 claimed, 5676/81/93* next
If 5693 claimed, 5700/05/5712*/22* in play
Level by Level Bearish Play (on Daily):
If 5545 fails, 5532*/23 in play
If 5532 fails, 5511*/5005/5000*/5490* next
If 5490 fails, 5472/53*/47/35* in play
If 5435 fails, 5415/5398/5380* next
If 5380 fails, 5350*/34*/5305* in play
Zoomed-out View:
🐂 Bullish: If 5500 holds or reclaimed (on weekly), 5705/5800 in play (hit 5705, still holding 5500)
🐻 Bearish: If 5622 fails to hold, 5590/5560/36/5511*- in play (failed to hold 5622 & hit 5560)
🔑 Key Levels:
Resistance: 5560, 5569*, 5578*, 5594, 5602*/08*, 5616*, 5655*/62*, 5630, 5635/38*, 5655, 5662, 5664/68*, 5676/81, 5693*, 5700, 5705, 5712*, 5722
Support: 5545, 5536*/32, 5523/19, 5515*/11*, 5505/00*, 5495*/90*, 5480*/72*, 5465, 5453*, 5447*, 5535, 5416, 5400*, 5593, 5385/80*, 5370*, 5347, 5334*, 5329*, 5320*, 5312, 5305*, 5299*, 5269*, 5258, 5250*, 5245*, 5237, 5227, 5217**, 5209/5202*
Possible Trade Plans:
Besides level by level plays detailed above, follow are possible additional long and short trade opportunities to consider.
Bears are clearly in control for now. Bulls need to claim the identified levels above to prove their intentions and commitment.
Until then, consider all long plays short-term and take profits level to level, even a bit earlier than profit targets.
On lower time frames, if the price holds or is quickly reclaimed after dropping a few points (3-5 pts) below these key support levels, consider going long with a stop loss below these levels and using 2nd and 3rd intra-day levels above these as posted daily on X.
Levels to consider for long plays: 5545, 5536/32, 5500/5435, 5350/35.
Short Trades:
On lower time frames, if the price goes above and quickly rejects these key resistance levels by a few points (3-5 pts), consider a short play with a stop loss above these levels and using 2nd and 3rd intra-day levels below these as posted daily on X.
Levels to consider for short plays: 5560/69, 5605/16*, 5655, 5664/68.
Red Flags:
Keep an eye out for potential signs of a bearish reversal on red days:
Moving flag levels up aggressively for early detection of trend change
Orange Flag: Close below 5622 questions the daily uptrend.
1st Red Flag: Close below 5560 suggests a potential shift in the short-term weekly uptrend bias.
2nd Red Flag: Close below 5500 indicates possible voiding of the short-term weekly uptrend bias.
#NQ_F / #NDX Futures:
📈 Weekly: cautious 🐻 📊 Daily: Cautious 🐂

Analysis:
Week closed in strong red, wiping out three weeks of bull gains with typical bear action
Changing weekly bias to bearish
Second red flag triggered on Friday, but a green day could follow, adding caution to bearish bias
If 19835 is claimed by bulls and 19785 holds on pullback, we could see an attempt to back test 19980, which might lead to a few green days
Bears defending 20145/20165 keeps 19500/230/100- in play
A red day close below 19700 opens up the possibility of 19230/100, 19025/940, 18700/660- in play
Claiming 19785 strengthens the bullish move but might still be just back testing 19980 or even 20145/165
If bulls claim 20165, bears start feeling weak but still interested
Claiming 20600 or at least 20535 would flush most bears from last week's move down and bring a new ATH into focus
Bears must defend 20145/165 and 20300/370 in case of higher back test rallies
Downside:
Below 19700, bears keep momentum
Key Support Levels: 19700/670, 19550/500, 19255/230, 19100/18975, 18705/660
Upside:
Above 19785, bulls keep hope
Key Resistance Levels: 19785/835, 19940/980, 20145/165, 20300/370*
Ideally, bears defend 19785/835 or at least 19940/980 to prevent higher back test pain
Failed breakouts around these levels are likely short plays for bears
Stick to trading level by level as usual.
Yearly View:
🐂 Bullish: As long 14265/14140 holds 20320/22640 in play (hit 20320 on June 20th)
🐻 Bearish: will determine when monthly trend turns bearish
Monthly Viewpoint:
🐂 Bullish Goal: As long 19245 holds or reclaimed, 20705*/820* in play (hit all monthly targets)
🐻 Bearish Goal: as long as 20535 defended by bears, 19245/18705/18435 in play
Weekly Perspective:
🐂 Bullish: If 19700 or 19670 holds and 19785 reclaimed, 20735*/850/890*/975/21045*+ in play
🐻 Bearish: If 19700 fails, 19550/500/230*/025/18975*- in play
Level by Level Bullish Play (on Daily):
If 19700 or 19670 holds, 19785*/835*/940/19980* in play
If 19980 claimed, 20145/20165* next
If 20165 claimed, 20300/370/535 in play
If 20535 claimed, 20600/700/725* next
Level by Level Bearish Play (on Daily):
If 19700 fails, 19625/550/500* in play
If 19500 fails, 19350/280*/230* next
If 19230 fails, 19190/100/025*/18975* in play
If 18975 fails, 18755/705*/660* next
Zoomed-out View:
🐂 Bullish: as long 19700/670 holds and 19785 reclaimed, 19945/20005*/20165/370*+ in play
🐻 Bearish: if 19700 fails to hold, 19500/230*/100/025*/875*- in play
🔑 Key Levels:
Resistance: 19730, 19785, 19835*, 19915, 19940, 19980/20005*, 20145/165*, 20300, 20370*, 20535, 20600*, 20655, 20700/725*, 20820/850*, 20895/920*, 20970*, 21005, 21045, 21095*, 21125, 21160/190*, 21240, 21330*
Support: 19700, 19670*, 19630, 19590*/555, 19500*, 19435*/400*, 19375/350*, 19310, 19280*, 19245/230*, 19190*, 19100/025*, 18995*, 18975/940*, 18855, 18800, 18780*, 18755/705*, 18660*, 18555*/510, 18480*, 18410*/390*, 18290*, 18245/230*, 18160*
Possible Trade Plans:
Besides level by level plays detailed above, follow are possible additional long and short trade opportunities to consider.
Long Trades:
Bears are in control for now. Bulls need to claim the identified levels above to prove their intentions and commitment.
Until then, consider all long plays short-term and take profits level to level, even a bit earlier than profit targets.
On lower time frames, if the price holds or is quickly reclaimed after dropping a few points (10-30 pts) below these key support levels, consider going long with a stop loss below these levels and using 2nd and 3rd intra-day levels above these as posted daily on X.
Levels to consider for long plays: 19700/670, 19550/500, 19255/230, 19100/18975, 18705/660
Short Trades:
On lower time frames, if the price goes above and quickly rejects these key resistance levels by a few points (10-30 pts), consider a short play with a stop loss above these levels and using 2nd and 3rd intra-day levels below these as posted daily on X.
Levels to consider for short plays: 19785/835, 19940/980, 20145/165, 20300/370*
Green Flags:
Keep an eye out for potential signs of a bullish reversal on green days:
Lime Flag: A close above 19980, daily downtrend is in question
1st Green Flag: A close above 20165 on a green day may suggest that the short-term weekly downtrend bias is in question.
2nd Green Flag: If the market closes above 20600 on a green day, indicating potential voiding of the short-term weekly downtrend bias.
#RTY_F / #RUT Futures:
📈 Weekly: Cautious 🐂📊 Daily: Cautious 🐂
Analysis:
Week closed in green, but weaker green as it couldn't finish above 2247, even after hitting the last monthly target of 2300
Bias remains bullish but with abundant caution
#DXY closed below key 103.880 on Wednesday but quickly reclaimed it and ended the week in green; this could pause #RTY's bullish move if the inverse correlation continues
Added caution to the bullish bias
Bulls need to:
Hold 2197 or at least 2183/75
Claim 2225 quickly and hold 2205 on any pullbacks
Defend 2150 in case of a deeper pullback to maintain bullish momentum to keep bullish move from week before last in play
Levels to watch:
Above 2201: Bulls keep momentum
Below 2194: Bulls enter pain zone
2183 or at least 2176: Last levels bulls must defend to continue last week's green streak
On the upside, claiming 2226 provides added support for the move up
Yearly View:
🐂 Bullish: Holding above 1867 targets 2247/2461/2575+.
🐻 Bearish: Will determine when monthly trend turns bearish
Monthly Viewpoint:
🐂 Bullish: as long 2053/2032 holds or reclaimed 2210/2247/2300+ in play (hit all monthly targets)
🐻 Bearish: As long bears hold 2058 or at least 2036, 1982/1960 in play (invalidated)
Weekly Perspective:
🐂 Bullish: If 2201 or 2197 holds and 2210 reclaimed, 2225.2/2248*/78/89*+ in play
🐻 Bearish: If 2197 fails, 2194/83/75/65/58*- in play
Level by Level Bullish Play (on Daily):
If 2201 or 2197 holds and 2210 reclaimed, 2225.2/2248/66/78 in play
If 2278 claimed, 2289*/96/2300* next
If 2300 claimed, 2311/2322/28 in play
If 2322 claimed, 2332/35*/2345/46.5* next
Level by Level Bearish Play (on Daily):
If 2197 fails, 2194/83/75* in play
If 2175 fails, 2169/65*/58* next
If 2158 fails, 2148/45* in play
If 2145 fails, 2140/30/26* next
Zoomed-out View:
🐂 Bullish: as long 2110/05 holds, 2247/2300 in play
🐻 Bearish: if 2197 fails, 2176*/65*/45- in play
🔑 Key Levels:
Resistance: 2210, 2221/25.2*, 2232, 2248*, 2253, 2260.5, 2266, 2278*, 2282.5*, 2286/89*, 2096/2300*, 2311, 2322, 2332/35*, 2345/2346.5*, 2360, 2364*, 2373*
Support: 2201/2197, 2194*, 2183, 2175, 2169, 2165*, 2158*, 2148/45*, 2140, 2130*/26*, 2119/14, 2110*/05*, 2098, 2085, 2080*, 2069*/65*, 2052/48*, 2038*, 2032, 2025.7*
Red Flags:
Keep an eye out for potential signs of a bearish reversal on red days:
Moving flag levels up aggressively for early detection of trend change
Orange Flag: A close below 2194 daily uptrend is in question
1st Red Flag: A week close below 2169 on a red day may suggest that the short-term weekly uptrend bias is in question.
2nd Red Flag: If the market closes below 2145 on a red day, indicating potential voiding of the short-term weekly uptrend bias.
Note about Terminology:
In my weekly reports and X (Twitter) posts, I often refer to terms like "must hold," "claim," or "fail." Here's a quick explanation of what these terms mean:
For intraday analysis: I consider the 15-minute or 1-hour candle close.
For trades spanning overnight to two days: I focus on the 4-hour candle close.
For a weekly or longer-term outlook: I rely on the daily candle close.
close above: claimed / close below: failed
These references are also available in the pinned thread on my X profile. I strongly recommend reading this thread for a deeper understanding of my chart analysis. If I get lot more subscribers and engagement, I plan to elaborate on my methodology in a separate Substack post in the future, the pinned thread on my X profile offers valuable insights for now.
Read this thread on X to learn about my chart reading method and examples of hold/fail/claim/reject setups for trade execution
Curious about your trading experiences. Share your trading moves inspired by this newsletter – the wins, the almost-wins, and the lessons learned. Drop your insights in the comments below or over on X (formerly Twitter). Let's learn and grow together!
Be nimble and adjust your strategies according to market conditions and the mentioned support and resistance levels. Monitor flag levels for early signs of bias shifts. If you're not following me on X @trdnvestor , consider doing so for daily updates.
Wish you a great trading week!
Disclaimer: This is NOT financial advice. I am NOT a financial advisor.
Fixed (10-30pts) above or below for #ES Possible Trade Plans. This should have been 3-5pts for #ES and 10-30pts for #NQ. Copy paste error :)