
Weekly Charts Reading for 3/17- 3/21
Will Relief Poppins?

Making this newsletter shorter — hope you’ll still find it actionable and helpful in your trading!
As always, I appreciate your likes, shares, and restacks on Substack and X.
Your feedback helps me know if I'm adding value to your trading.
Given the abundance of numbers in this newsletter, there's a chance I might make a typo. If you spot any errors, please give me a heads up. Thanks a bunch!
Note about levels above ATH
Upside targets are estimated without left-side confirmation on the chart, utilizing a combination of Fibonacci and trend lines across multiple time frames. Feel free to reach out if these levels prove effective; otherwise, your understanding is appreciated.
These levels are subject to refinement as prices evolve throughout the days.
In the event of new highs, prioritizing profit-taking based on risk-to-reward multiples is recommended, rather than waiting for specific target levels to be reached.
How’s last week?
Last week, I said bears were in control, and any bounces were just counter-trend until key resistance was reclaimed.
Bulls couldn’t even test the first resistance levels, and bears dominated until Thursday.
I didn’t trade but posted daily levels on X 4 out of 5 days—few paid attention. :)
On the bright side, last week’s newsletter got more likes than usual—appreciate it!
Read here how I use this Weekly Newsletter in my daily trading.
Feel free to scroll down to the end of the report to get a rundown on some of the terms I’m throwing around, like “hold”, “claim”, and “fail”
Disclaimer: This is NOT financial advice. I am NOT a financial advisor.
Week Ahead (3/17 – 3/21)
Markets found short-term support Thursday. Friday's gap up, break above the previous day's high, and solid green close marked the first slight bullish move since early March.
This raises hopes for some continuation of a relief rally.
Any bounces/rallies—no matter how strong—will still be treated as counter-trend moves until key levels (identified below) are claimed on daily/weekly .
The past 3-4 Wednesdays' highs remain critical resistance points bulls must claim for bears to gradually lose control.
Will this week's FOMC Rate Decision & Press conference break the cycle of short-lived spikes and dumps, or will recent patterns persist?
Key Reminders:
Always protect your profits and have a plan ready in case the market does the unexpected (it often does, right?).
I stick to trading level by level, as outlined below.
Events Calendar :

Quick Summary:
#ES Bullish above 5580, Bearish below 5538
Bulls weak < 5885
Bears keep momentum < 5791
#NQ Bullish above 19475, Bearish below 20290
Bulls weak < 21120
Bears keep momentum < 20290
#RTY Bullish above 2019, Bearish below 2001
Bulls weak < 2290
Bears keep momentum < 2220
#YM Bullish above 41140, Bearish below 40905
Bulls weak < 44120
Bulls keep momentum > 42810
#SI Bullish above 33.54, Bearish below 33.16
If 33.55 holds/reclaimed, 34, 34.45, 34.80, 35, 35.18, 35.45/35.55, 35.70*+
If 33.16 fails, 33, 32.85, 32.45/35, 32.27, 32.15, 32-
#GC Bullish above 2950/42, Bearish below 2923
If 2950 holds/reclaimed, 2990, 3000/3005, 3025, 3050, 3080/90, 3115+
If 2923 fails, 2900, 2890, 2880, 2872, 2866, 2855-
#PL Bullish above 1002, Bearish below 998
Above 998 bulls keep momentum from last week. Still need to claim 1019 on daily
If 1008/1002 holds, 1017/1020, 1037, 1049, 1058, 1065*+
If 998 fails, 980/977, 970, 964, 960, 956, 950/947, 938, 925-
#PA Bullish above 969, Bearish below 964
Bulls weak < 993
Bears lose control step by step 993* → 1020*
If 969 holds, 989, 993/996, 1008, 1014/1020, 1026, 1040+
If 964 fails, 946*, 941, 935, 925/922, 917, 906-
Based on Feb close, if 900 fails to hold, fast move to test 825/813- likely
#CL Bullish above 66.80, Bearish below 66.59
Bears control < 74.75
Bears keep momentum < 71.25
Bears lose control step by step 68.58 → 70.30 → 71.25 → 73.20* → 74.75
If 66.80 holds, 68.10/68.58, 69.80, 70.30, 70.60, 70.90, 71.25+
If 66.59 fails, 66.28, 65.92, 65.53, 65.22, 65, 63.65, 62*, 61.56-
Quick Plays:
#ES:
Current Outlook:
Even though bears are still in control until 6016 is claimed on daily, if 5580/57 holds, bulls could back test 5677, 5757, 5772, and 5791+.
If 5791 is claimed on daily, bears start losing short-term momentum.
Bulls are weak < 5885.
Bears maintain momentum < 5791.
Friday's EOM squeeze hit key 5647 (5748.75 high) but couldn’t claim it, increasing the likelihood of a back test to 5610/5595/5581 supports unless bulls reclaim 5748 quickly.
Currently below 5815/5742, key monthly supports.
Bears lose control step by step when a green day closes above: 5677 → 5791 → 5885 → 6016 → 6030 → 6050 → 6069.
Ideal Bullish Scenario
Bulls hold 5617/10 as support and quickly reclaim 5648 and 5655, bringing 5677, 5690, 5723, 5757*+ into play.
Ideal Bearish Scenario
Bears hold 5638/5655 or below, then claim 5610 first, followed by 5580 and 5557 (hourly/4hr red candle close below), opening up 5511, 5500, 5485/56, 5418/10, 5400/5393- as targets.
Big Picture
If 5677 is reclaimed on daily while holding 5562, expect 5690, 5723, 5757, 5772, 5791, 5807, 5844+ to come into play.
If 5538 fails to hold on daily, targets include 5500, 5485/64, 5403/5393-.
If 5393 fails to hold on daily, look for 5345/30, 5300, 5202- as likely moves.
Support Levels
Intra-day: 5617/10*, 5591, 5580*, 5562, 5557*, 5539, 5525, 5511*
Daily: 5538, 5500*/5485*, 5448, 5410/03*, 5394
Weekly: 5403/5394, 5330/5300, 5215/5200
Monthly: 5500, 5300*, 5050
Yearly: 5405, 5246, 5005
Resistance Levels
Intra-day: 5638, 5648*/55*, 5675, 5690*, 5720/25, 5731, 5752/57*
Daily: 5655/77*, 5757/72, 5791*, 5845, 5870/85*
Weekly: 5772*, 5967, 6000/6016*
Monthly: 5772*, 5970*, 6065*, 6165
Yearly: 6165/6460*, 6515/6640, 7300
Yearly View
Bullish: As long as 5405/5246 holds, targets 6515, 7300+.
Bearish: If bears hold 6051, targets 5740, 5405, 5330-.
#NQ:
Current Outlook:
Bulls are weak < 21120.
Bears keep momentum < 20290.
Multi-week downtrend likely to continue unless 21410/21460 is claimed on daily.
Until 20290 is claimed by bulls on daily, the test of 18840/18380- remains a possibility.
This doesn’t mean there won’t be rallies within the downtrend.
Based on Friday's close, as long as 19600/475 holds and 19705 & 19790 are claimed, back test targets include 20150/205, 20290*+.
If 19800 is claimed on daily, 20150/205 and 20290* are the next targets.
If 20290 is claimed, look for 20605/650, 20735, and 21120+ as potential next moves.
If 19295 fails on daily, the next down leg starts, bringing 19185, 18970, 18840, and 18720*- into play.
If 19170 fails, expect a quicker, deeper move to test 18590* and 18385*.
If 18385 fails to hold on daily, the next leg down begins, with 18165, 17855, and 17230 as possible targets.
Bears lose control step by step when a green day closes above: 19800 → 20290 → 20735 → 21120 → 21250 → 21410 → 21460 → 21700 → 21815
Ideal Bullish Scenario
Bulls hold 19605/475 as support and quickly reclaim 19705 and 19750, continuing to 19790, 20005, 20150/205, 20290+.
Ideal Bearish Scenario
Bears hold 19725/19790 or below, then claim 19610 first, followed by 19475 (hourly/4hr red candle close below), opening up 19395/19295, 18970, 18830- as targets.
Big Picture
If 19790 is reclaimed on daily, 20150/205, 20290, 20325, 20515, and 20650*+ are in play.
If 19295 fails on daily, expect 19170, 18970, 18835, 18725, and 18590*- as targets.
Support Levels
Intra-day: 19630, 19590*, 19475*, 19440, 19390*, 19340, 19295*
Daily: 19295*, 19130, 18835*, 18725*, 18590*/550*
Weekly: 19500*, 19170, 18380*/340
Monthly: 19590*, 18590, 18335*, 18165
Yearly: 19650/500, 18590/18400, 17465
Resistance Levels
Intra-day: 19705/730*, 19790*, 19915, 19970, 20020*, 20055, 20110*, 20165*
Daily: 19790*, 20150/215*, 20290*, 20605/650*, 20735*, 21005, 21120*
Weekly: 20215/290*, 21120*, 21700/815*
Monthly: 21005*, 21460*/570, 22245
Yearly: 22060/22310, 22650/23610, 24620/26700
Yearly View
Bullish: As long as 19500/18400 holds, targets 23600, 24620, 26700, 27800+.
Bearish: If bears hold 22060/22310, targets 5740, 5405, 5330-.
[BONUS]
The following trade plans were generated by ChatGPT using my method and the chart levels above. Use your judgment to make your own decisions.
Not financial advice.
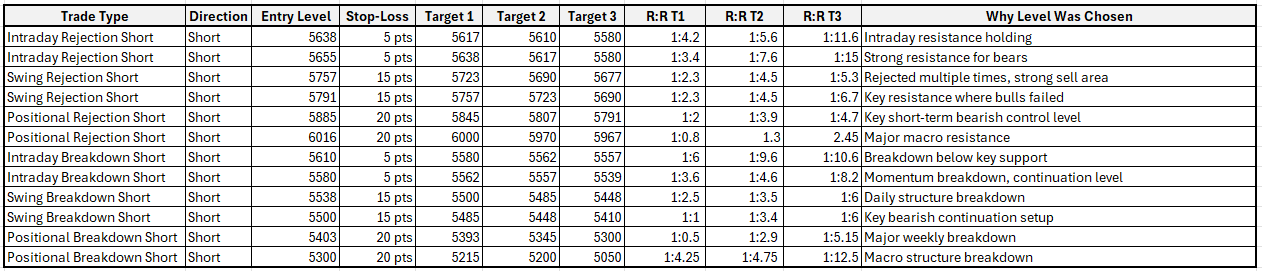
#ES
🐂 Bullish Control Levels:
Above 5677 → Bulls regain control, targeting 5690 → 5723 → 5757 → 5772 → 5791+.
Above 5791 → Bulls regain momentum, aiming toward 5807 → 5844+.
Above 5885 → Bulls build strength, aiming for 6016 → 6030 → 6050 → 6069.
🐻 Bearish Control Levels:
Below 5610/5595 → Bears take control, targeting 5580 → 5557 → 5511 → 5500.
Below 5580 → Bearish continuation toward 5485/56 → 5418 → 5400/5393.
Below 5393 → Accelerated downside risk toward 5345/30 → 5300 → 5202-.
Long Setup:

Short Setup:
#NQ
🐂 Bullish Control Levels:
Above 19790 → Bulls regain control, aiming toward 20150/205 → 20290 → 20325 → 20515 → 20650.
Above 20290 → Bulls regain momentum, targeting 20605 → 20735 → 21120.
Above 20650 → Strength builds toward 20735 → 21000 → 21120.
🐻 Bearish Control Levels:
Below 19600/475 → Bears take control, targeting 19475 → 19390 → 19295 → 18970.
Below 19295 → Bearish continuation toward 19185 → 18970 → 18840 → 18720.
Below 18840 → Accelerated downside risk toward 18590 → 18385 → 18165 → 17855
Long Setup:
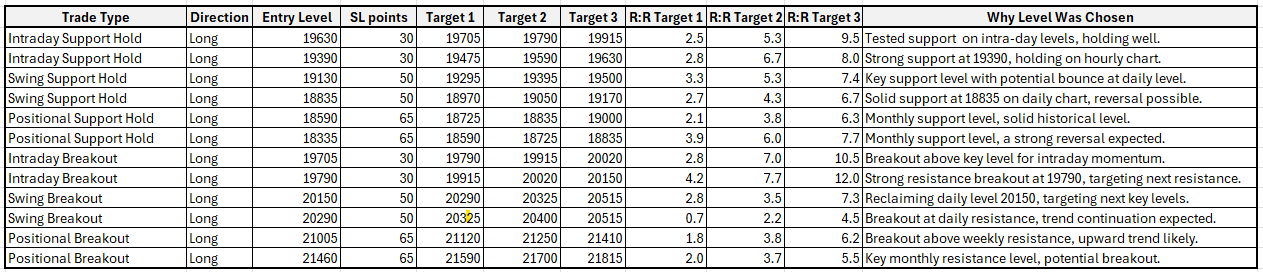
Short Setup:

Guidelines for Entry Confirmation
Candle Close Rules:
Intraday: Confirm breakouts/failures with 15m/hourly candle close at intraday levels.
Daily: Confirm with hourly/4-hourly candle close at daily levels.
Weekly: Confirm with daily candle close at weekly levels.
Handling Breakouts / Breakdowns:
High Probability of Initial Failure:
Be prepared to lose the first breakout/breakdown trade if it reverses.
Use the next reversal candle for a quick switch to short/long if risk reward is at least 1:2.
Second attempts at breakout/breakdown levels are likely more successful.
Better Entries: After a failed breakout/breakdown, often you get a better long/short entry at the next support/resistance level when price reverses upward/downward.
Typical Stop Loss Examples:
#ES_F:
Intraday Trades: Use a 3-5 point SL with a minimum 10-point target.
Swing Trades: Use a 10-15 point SL with a minimum 30-point target.
#NQ_F:
Intraday Trades: Use a 20-25 point SL with minimum 40-50 point target.
Swing Trades: Use a 30-35 point SL with minimum 60-80 point target.
Always maintain a minimum 1:2 risk/reward ratio with targets.Intraday trades focus on quicker moves, while swing trades aim for larger targets.Use partial exits for scaling out and securing profits while leaving room for extended targets.Stick to stop-loss levels to manage risk.Avoid over-trading; wait for clear setups.Monitor price action at key levels for confirmation.Be flexible and reenter only if conditions realign after a failure.
What does bear pressure or bulls weak below a level means?
More Sell the rally (STR) than Buy the dip (BTD) until claimed on a higher time frame.
Trading Time frames: Candle close above
Intraday: 1 or 4 hrly
Short-term: Daily
Long-term: Weekly
Note about Terminology:
In my weekly reports and X (Twitter) posts, I often refer to terms like "must hold," "claim," or "fail." Here's a quick explanation of what these terms mean:
For intraday analysis: I consider the 15-minute or 1-hour candle close.
For trades spanning overnight to two days: I focus on the 4-hour candle close.
For a weekly or longer-term outlook: I rely on the daily candle close.
close above: claimed / close below: failed
These references are also available in the pinned thread on my X profile. I strongly recommend reading this thread for a deeper understanding of my chart analysis. If I get lot more subscribers and engagement, I plan to elaborate on my methodology in a separate Substack post in the future, the pinned thread on my X profile offers valuable insights for now.
Read this thread on X to learn about my chart reading method and examples of hold/fail/claim/reject setups for trade execution
Curious about your trading experiences. Share your trading moves inspired by this newsletter – the wins, the almost-wins, and the lessons learned. Drop your insights in the comments below or over on X (formerly Twitter). Let's learn and grow together!
Be nimble and adjust your strategies according to market conditions and the mentioned support and resistance levels. Monitor flag levels for early signs of bias shifts. If you're not following me on X @trdnvestor , consider doing so for daily updates.
Wish you a great trading week!
Disclaimer: This is NOT financial advice. I am NOT a financial advisor.