
Weekly Charts Reading for 2/17- 2/21
Thursday Sticks, Bulls Click

As always, I appreciate your likes, shares, and restacks on Substack and X.
Your feedback helps me know if I'm adding value to your trading.
Given the abundance of numbers in this newsletter, there's a chance I might make a typo. If you spot any errors, please give me a heads up. Thanks a bunch!
Note about levels above ATH
Upside targets are estimated without left-side confirmation on the chart, utilizing a combination of Fibonacci and trend lines across multiple time frames. Feel free to reach out if these levels prove effective; otherwise, your understanding is appreciated.
These levels are subject to refinement as prices evolve throughout the days.
In the event of new highs, prioritizing profit-taking based on risk-to-reward multiples is recommended, rather than waiting for specific target levels to be reached.
How’s last week?
Another gap-down open last week, but #ES, #NQ, and #YM held key higher-low supports perfectly.
Metals rallied but dumped Friday, retesting last week’s breakout levels.
#CL nailed levels again—73.35 resistance, 70.42 support. Bears still in control.
Read here how I use this Weekly Newsletter in my daily trading.
Feel free to scroll down to the end of the report to get a rundown on some of the terms I’m throwing around, like “hold”, “claim”, and “fail”
Disclaimer: This is NOT financial advice. I am NOT a financial advisor.
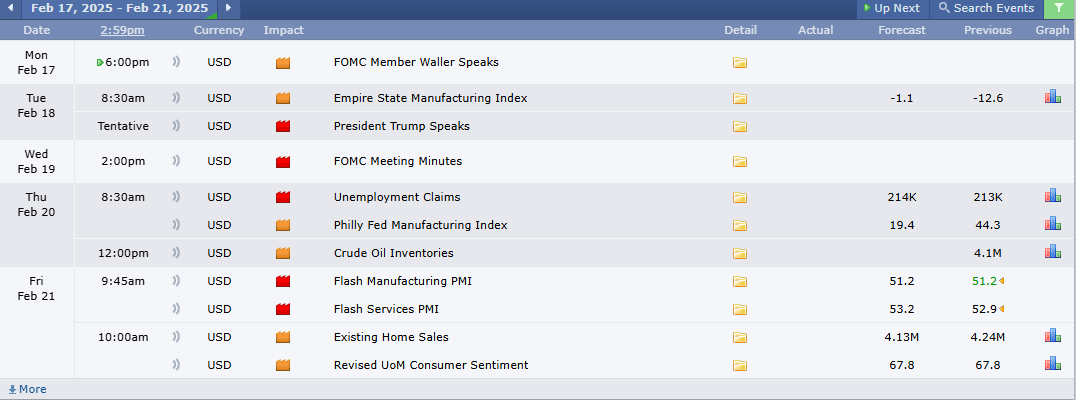
Week Ahead (2/17 – 2/21)
Short trading week with markets closed Monday for Presidents' Day.
Next week brings usual economic reports, plus Tuesday’s Trump interview and Wednesday’s FOMC Minutes—expect some volatility.
Earnings season rolls on with big names like $WMT, $BABA, $TOL, $BKNG, $OXY, $RIVN, $MELI, and more.
In short, if the market holds or reclaims Thursday’s open/low quickly, the bullish move continues.
Key Reminders:
Always protect your profits and have a plan ready in case the market does the unexpected (it often does, right?).
I stick to trading level by level, as outlined below.
Events Calendar :
Quick Summary:
#ES Bullish above 6099, Bearish below 6070
Bears weak > 6054
Bulls keep momentum > 6122
#NQ Bullish above 22105, Bearish below 22050
Bears weak > 21960
Bulls keep momentum > 22105
#RTY Bullish above 2267, Bearish below 2258
Bulls weak < 2336
Claiming 2305 & then 2333/36 - key for bullish continuation
#YM Bullish above 44550/44505, Bearish below 44360
Bulls weak < 44970
Claiming 44970/45175 - key for bullish continuation
#SI Bullish above 32.55, Bearish below 32.45
Bulls weak < 33.275
32.55/32.45 key support for bulls to make one more run for 32.95*, 33.275*, 33.85*, 34.05, 34.25*, 34.60+
In a deeper pullback, bulls must hold/defend or reclaim 32.05 quickly
If 32.45 fails, 32.16/32.10, 32.05*, 31.92, 31.87, 31.67*/31.57**- in play
Bulls lose control 32.45 → 32 → 31.55 → 30.94 → 30.56
#GC Bullish above 2885, Bearish below 2875
Back to almost same levels as last week!
In case of deeper pullback, bulls must defend 2856 to bring back 2892, 2910, 2923, 2952, 3000+ in play
If 2875 fails, 2870*, 2856*, 2850/2846*, 2837*/30, 2825- in play
Bulls lose control step by step 2875 → 2837 → 2795
#PL Bullish above 1008, Bearish below 1008
Bulls still weak < 1045
Back to almost same levels as last week!
As long 1003/998 holds, 1023, 1038*, 1050*, 1060/65*, 1072*+ in play
If 1008 fails, 998*, 991*, 979*, 971*/965, 957*, 951- in play
979 last level for bulls to defend to keep last month's move in play
Bears lose control step by step 1038 → 1050* → 1065*
#PA Bullish above 988, Bearish below 978
Bulls still weak < 1070
If 988 holds/reclaimed, 1009, 1025, 1038*, 1050, 1063*, 1070, 1080*+ in play
If 978 fails, 974, 965, 959*, 951/944*, 937/934*, 928*, 918- in play
Bears lose control step by step 1005 → 1025 → 1063 → 1080*
1120/50 are key resistance for bulls to claim and hold to confirm reversal of multi year downtrend
#CL Bullish above 70.36, Bearish below 70.12
Bulls weak < 73.40
Bears control < 75.20
Back to almost same levels as last week!
As long 70.36 holds, 70.80, 71.15, 71.6*, 71.85*, 72*, 72.55*, 73.20/73.40*, 74, 74.55+ in play
If 70.12 fails, 69.80, 69.60*, 69.4*/69.25*, 69*, 68.45*, 67.20*- in play
Bears lose control step by step 72 → 73.40* → 75.20
After 4 strong red weeks, bulls have last chance to keep the move from Dec in play
Quick Plays:
#ES:
Key Levels Recap:
Last week, 6020/6003 were key weekly supports for bulls. They tested 6020 precisely and held.
Current Outlook:
Bears remain weak above 6054.
Bulls must hold/reclaim 6078/6070 to sustain upside momentum.
6054 is the last line of defense for bulls—losing it boosts bear confidence.
If 6053 fails, but quickly dips to 6031 and recovers 6054, that’s bullish.
A red close below 6053 puts 6020/14*, 5983*, 5968*/60, 5935, and 5900/5890 in play.
5945 is a key monthly support.
Bulls lose control step by step with red closes below 6053 → 6014 → 5945.
Ideal Bullish Scenario:
Bulls hold 6031/22 as support and reclaim 6148, targeting 6164*, 6215, 6248*, 6287+.
Ideal Bearish Scenario:
Bears hold 6148 or lower, then break 6122 (hourly/4hr red close) to target 6099*, 6078/70*, 6054*, 6031*-.
Big Picture:
If 6031/20 holds/reclaimed on daily: Targets 6148, 6248, 6290, 6385+.
If 6014 fails on daily: Targets 5983*, 5945/35*, 5890, 5865*/09*.
Support Levels:
Intra-day: 6132*, 6124/22*, 6109*, 6099*/95, 6078/70*, 6058/53*
Daily: 6078*/54*, 6031/20*, 5983*, 5948/35*
Weekly: 6070*, 6016*, 5983*, 5865*/60*
Monthly: 5945*, 5865, 5815*/5800, 5745
Yearly: 5405, 5246, 5005
Resistance Levels:
Intra-day: 6138, 6143/48*, 6154, 6164*
Daily: 6148*, 6164/90*, 6215, 6285*
Weekly: 6164*, 6248*, 6290*, 6310
Monthly: 6153*/90, 6248/6260*, 6310
Yearly: 6165/6460*, 6515/6640, 7300
Yearly View
Bullish: As long as 5405/5246 holds, targets 6515, 7300+.
Bearish: If bears hold 6051, targets 5740, 5405, 5330-.
#NQ:
Key Levels Recap:
Last Sunday’s gap-down tested key 21430 support (21418 low), then quickly recovered and reclaimed 21530—a bullish above level which was tested again after Wednesday’s CPI report.
From there, the market pushed higher, claiming key 21970 and 22090 resistance levels.
Current Outlook:
Bears remain weak above 21960.
A quick flush below 22040 to 21995/960, followed by a same-day reclaim of 22050, is still bullish.
If Friday’s low fails on the daily, 21860/820 is an ideal spot for bulls to form a higher low and continue upward.
If 21820 fails, next supports are 21750 and 21670.
If 21750 fails, expect 21460/420* and 21210* to come into play.
If 21210 fails, 20980/940* is next.
Bulls must hold 21860/820 as the first weekly support to maintain upside momentum.
21460 is the last weekly support to keep bulls in play—losing it opens the door for more downside.
Above 22050, bulls keep ATH/22850/23000 in play.
Bulls lose control step by step with red closes below 22040 → 21820 → 21420 → 20940.
A daily/weekly close below 20940 could trigger a multi-week downtrend, potentially bringing 20500/380*/20010*/19900/19500* into play.
Ideal Bullish Scenario:
Bulls defend 22155/105 and quickly reclaim 22310, targeting 22425 and ATH+.
Ideal Bearish Scenario:
If 22040 fails, expect 21960/920, 21875/820*, and 21775*- to come into play.
Big Picture:
If 21530 holds or is reclaimed: Targets 21915/970/22090/22310/22650+.
If 21430 fails: Targets 21375/240/200*/170/20970*.
Support Levels:
Intra-day: 22155, 22105, 22050*, 21995, 21960*, 21920, 21820*
Daily: 22040*, 21960/820*, 21750*/670*, 21465
Weekly: 21820*/750*, 21465/415*, 21200*, 20980*
Monthly: 21210*, 20940*, 20070*/20010*
Yearly: 19650/500*, 18590/18400*, 17465
Resistance Levels:
Intra-day: 22225, 22290*, 22320*, 22375*, 22410*
Daily: 22310, 22415*, 22610*, 22890*
Weekly: 22425*, 22760, 23130*
Monthly: 22060, 22425/22525, 23230
Yearly: 22060/22310, 22650/23610, 24620/26700
Yearly View
Bullish: As long as 19500/18400 holds, targets 23600, 24620, 26700, 27800+.
Bearish: If bears hold 22060/22310, targets 5740, 5405, 5330-.
#RTY:
Key Levels Recap:
Expected another attempt to test and claim 2333/36, but it didn’t happen.
Instead, bullish weakness or bearish strength prevailed, testing 2235 (second weekly support, 2231.4 low) before bouncing back to 2306.
Current Outlook:
Bulls remain weak below 2336.
Bearish until 2307 is claimed on the daily or at least the 4-hour chart.
Bears gain strength if a red day closes below 2258.
Since making a high in November, price has been consolidating in a broad range between 2198 and 2336.
Two weeks ago, 2198 was tested and bounced. Last week, despite not testing 2336, a green weekly close keeps the bullish bias intact for at least 2328-2336.
If 2336 isn’t claimed after testing, expect a move back toward 2258-2197, with potential for even lower levels.
Key supports: 2267 for the week, 2259 for the month.
Ideal Bullish Scenario:
Bulls defend 2270/67 and quickly reclaim 2307 to target 2328/36, 2346, and 2363+.
A close above 2336 on the hourly or 4-hour chart signals stronger commitment and reinforces the bullish move.
Ideal Bearish Scenario:
Bears hold 2305 and quickly claim 2258 (confirmed by an hourly/4-hour red close), bringing 2235*, 2217, 2209, and 2197*- into play.
Big Picture:
If 2285 holds and 2333 is claimed on the daily: Targets 2363/2386/2395+.
If 2275 fails on the daily: Targets 2261/58/36*/14/2196-.
Support Levels:
Intra-day: 2285/82*, 2275, 2270/67*, 2260
Daily: 2267*/58*, 2235*, 2213/09*, 2196*
Weekly: 2267*/2258*, 2235*, 2197*
Monthly: 2258*/51, 2195/2181*, 2068/2033*
Yearly: 2194/2181*, 2058*, 1972*
Resistance Levels:
Intra-day: 2290*, 2296*, 2301/2305*, 2319
Daily: 2301/2305*, 2319, 2328*, 2333/36*
Weekly: 2307*, 2336*, 2373*, 2390/2400
Monthly: 2336*, 2445, 2468*, 2560*
Yearly: 2463, 2615/2756, 3000
Yearly View
Bullish: As long as 2181/2058 holds or is reclaimed, targets 2315, 2463, 2615/2756+.
Bearish: If bears hold 2315/2445, targets 2081*, 2058*, 1972, 1916-.
#YM:
Key Levels Recap:
Last week, bulls needed to hold 44410/350 – they defended 44100 during the Sunday gap down and reclaimed 44410 the same night, keeping bullish momentum intact.
Price hit the first weekly resistance at 44850 (high: 44879) before pulling back.
Current Outlook:
As expected, bulls were weak below 44970 last week, leading to selling on every up move; however, price continued making higher lows and highs on the 4-hour chart.
This price action maintains a bullish bias, with potential for a retest of 44970 and possibly a breakout.
Bulls remain weak below 44970.
Bulls must defend 44500/360 to sustain bullish momentum.
A red daily close below 44360 could lead to multiple red days.
If 44195 fails on the daily, then 43680/43345 comes into play.
44390/360 is key weekly support.
43345 is key monthly support.
Ideal Bullish Scenario:
Bulls hold 44550/500 and reclaim 44750* to resume testing 44815, 44970*, 45070*, 45175*, and beyond.
A close above 44970 on the hourly or 4-hour chart signals intent to test 45075/225/355/700+.
Ideal Bearish Scenario:
Bears defend 44750/44815/44880 and claim 44360 (confirmed by an hourly/4-hour red close), bringing 44180, 44070, 43965*, and 43845 into play.
Big Picture:
If 44360 holds or is reclaimed on the daily, then 44750/970/45155/ATH+ come into play.
If 43360 fails on the daily, then 44180, 43965, 43720/680*, and 43345* become the downside targets.
Support Levels:
Intra-day: 44550/500, 44470/430, 44390*, 44300*
Daily: 44360*, 44240/180*, 44100/43965*
Weekly: 44390*, 44180*/44100*, 43680*
Monthly: 43345*/320, 42940/810*, 41970**/41790*
Yearly: 40330*/41260, 40100/39335, 37900
Resistance Levels:
Intra-day: 44695, 44750*, 44815*, 44880*, 44970*
Daily: 44825*/970*, 45045/45175*, 45355
Weekly: 44850, 45155*, 45355, 45600
Monthly: 45155, 45355, 45900, 47440
Yearly: 45050, 46975, 48050, 49685
Yearly View
Bullish: As long as 41790/40100 holds or is reclaimed, targets 45050, 46975, 48050, 49685+.
Bearish: If bears hold 44485/45050, targets 41790/40100/37870-.
[BONUS]
Here are example long and short setups based on the levels above.
Not financial advice.
#ES
Long Setup:
Support Hold:
If 6133/22 support holds
If 6054 support holds
Quick Flush & Reclaim:
Long above 6054 if there’s a dip to 6031 followed by a fast recovery and reclaim of 6054.
This confirms a bear trap and signals bullish momentum.
Holding/Reclaiming Weekly Support:
Long at 6078/6070 if price holds or reclaims these weekly support levels, confirming continuation higher.
Deep Pullback Reversal:
Long at 5945 if price stabilizes, as this is key monthly support and a strong level for a potential bounce.
Short Setup:
Failed Reclaim & Rejection:
Short below 6070 if price retests but fails to reclaim this key weekly support, signaling weakness and a move toward 6054.
Break of Last Bullish Defense:
Short below 6054 if price breaks and retests it as resistance, confirming bearish momentum toward 6031.
If 6031 doesn’t hold, expect continuation lower.
Major Breakdown Confirmation:
Short below 6053 on a red close if price closes a red day below 6053, opening up downside targets at 6020/14 → 5983 → 5968/60.
Break & Retest of Monthly Support:
Short below 5945 if price breaks and retests this key monthly support, signaling a larger breakdown toward 5900/5890 and beyond.
#NQ
Long Setup:
Support Holds:
If 22155/105 support holds
If 22050 support holds
Quick Flush & Reclaim:
Long above 22050 if there's a flush below 22040 to 21995/960 followed by a same-day reclaim of 22050.
Higher Low Setup:
Long at 21860/820 if price holds on the hourly and shows signs of reversal, as this is the first major weekly support for bulls.
Deep Pullback Reversal:
Long at 21460/420 if price stabilizes, as this is the last key weekly support before a larger breakdown risk.
Short Setup:
Failed Reclaim & Rejection:
Short below 22040 if price attempts to reclaim but fails, especially if it rejects 22050 after a flush below 21995/960.
This confirms bulls losing momentum step by step.
Break of Key Support:
Short below 21820 if price breaks and retests this level as resistance. This signals a shift in control towards 21750/21670 next.
Break & Retest of Last Bullish Defense:
Short below 21460/420 if price closes an hourly candle under it and fails to reclaim.
This is the last key weekly support, and losing it increases the probability of 21210/20940 coming into play.
Major Breakdown Confirmation:
Short below 20940 on a red close if a daily or weekly candle closes under this level, signaling the start of a multi-week downtrend toward 20500/19900.
Guidelines for Entry Confirmation
Candle Close Rules:
Intraday: Confirm breakouts/failures with 15m/hourly candle close at intraday levels.
Daily: Confirm with hourly/4-hourly candle close at daily levels.
Weekly: Confirm with daily candle close at weekly levels.
Handling Breakouts:
High Probability of Initial Failure:
Be prepared to lose the first breakout trade if it reverses.
Use the next reversal candle for a quick switch to short if risk reward is at least 1:2.
Second attempts at breakout levels are likely more successful.
Better Entries: After a failed breakout, often you get a better long entry at the next support level when price reverses upward.
Typical Stop Loss Examples:
#ES_F:
Intraday Trades: Use a 3-5 point SL with a minimum 10-point target.
Swing Trades: Use a 10-15 point SL with a minimum 30-point target.
#NQ_F:
Intraday Trades: Use a 20-25 point SL with minimum 40-50 point target.
Swing Trades: Use a 30-35 point SL with minimum 60-80 point target.
Always maintain a minimum 1:2 risk/reward ratio with targets.Intraday trades focus on quicker moves, while swing trades aim for larger targets.Use partial exits for scaling out and securing profits while leaving room for extended targets.Stick to stop-loss levels to manage risk.Avoid over-trading; wait for clear setups.Monitor price action at key levels for confirmation.Be flexible and reenter only if conditions realign after a failure.
What does bear pressure or bulls weak below a level means?
More Sell the rally (STR) than Buy the dip (BTD) until claimed on a higher time frame.
Trading Time frames: Candle close above
Intraday: 1 or 4 hrly
Short-term: Daily
Long-term: Weekly
Note about Terminology:
In my weekly reports and X (Twitter) posts, I often refer to terms like "must hold," "claim," or "fail." Here's a quick explanation of what these terms mean:
For intraday analysis: I consider the 15-minute or 1-hour candle close.
For trades spanning overnight to two days: I focus on the 4-hour candle close.
For a weekly or longer-term outlook: I rely on the daily candle close.
close above: claimed / close below: failed
These references are also available in the pinned thread on my X profile. I strongly recommend reading this thread for a deeper understanding of my chart analysis. If I get lot more subscribers and engagement, I plan to elaborate on my methodology in a separate Substack post in the future, the pinned thread on my X profile offers valuable insights for now.
Read this thread on X to learn about my chart reading method and examples of hold/fail/claim/reject setups for trade execution
Curious about your trading experiences. Share your trading moves inspired by this newsletter – the wins, the almost-wins, and the lessons learned. Drop your insights in the comments below or over on X (formerly Twitter). Let's learn and grow together!
Be nimble and adjust your strategies according to market conditions and the mentioned support and resistance levels. Monitor flag levels for early signs of bias shifts. If you're not following me on X @trdnvestor , consider doing so for daily updates.
Wish you a great trading week!
Disclaimer: This is NOT financial advice. I am NOT a financial advisor.
Thank you!