
Weekly Charts Reading for 2/10- 2/14
End Zone or Turnover?

Keeping this newsletter short and sweet—but I think you’ll find it actionable and helpful for your trading!
As always, I appreciate your likes, shares, and restacks on Substack and X.
Your feedback helps me know if I'm adding value to your trading.
Given the abundance of numbers in this newsletter, there's a chance I might make a typo. If you spot any errors, please give me a heads up. Thanks a bunch!
Note about levels above ATH
Upside targets are estimated without left-side confirmation on the chart, utilizing a combination of Fibonacci and trend lines across multiple time frames. Feel free to reach out if these levels prove effective; otherwise, your understanding is appreciated.
These levels are subject to refinement as prices evolve throughout the days.
In the event of new highs, prioritizing profit-taking based on risk-to-reward multiples is recommended, rather than waiting for specific target levels to be reached.
How’s last week?
Somewhat anticipated a gap-down open last week, and the market delivered. But Sunday’s flush dropped lower than expected.
Recovered key support levels, and bulls took charge—just like the previous week.
Sunday night, I tweeted that markets were at support, with a back test likely once the hourly & 4H candles turned green.
Sure enough, that’s exactly what happened.
#GC hit my 2875, 2890, and 2905 targets.
#SI threw its usual tantrums.
#PL & #PA pulled back, with #PA dropping sharply.
#CL respected levels perfectly—75.20 on the upside, 70.45 on the downside.
Read here how I use this Weekly Newsletter in my daily trading.
Feel free to scroll down to the end of the report to get a rundown on some of the terms I’m throwing around, like “hold”, “claim”, and “fail”
Disclaimer: This is NOT financial advice. I am NOT a financial advisor.
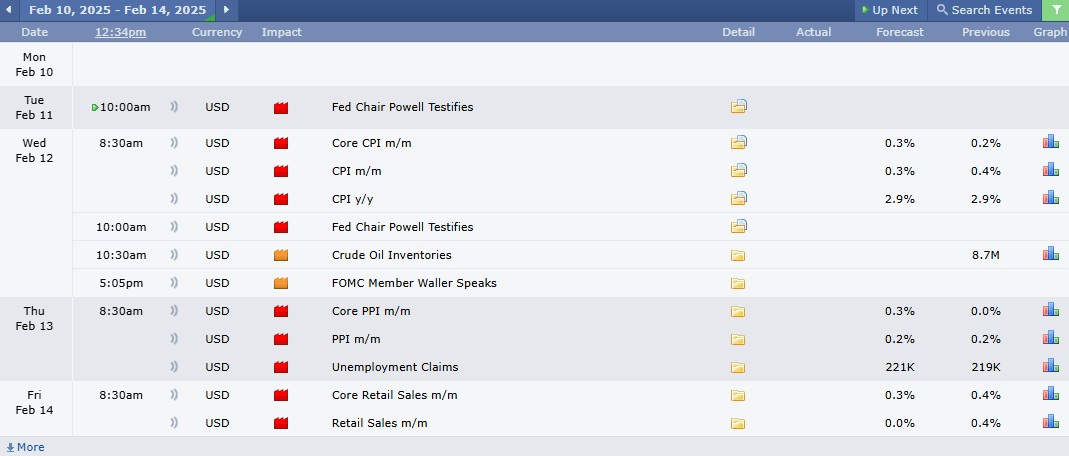
Week Ahead (2/10 – 2/14)
Another busy week ahead with key economic reports from Wednesday to Friday.
Expect volatility to kick off early with Fed Chair Powell’s testimony on Tuesday, followed by Wednesday’s CPI report.
Earnings season rolls on, with major reports from $KO, $MCD, $CSCO, plus $PANW, $AAP, $RDDT, $COIN, $SMCI, and more.
Plenty of catalysts to keep volatility high.
Last two weeks followed the same pattern: Sunday gap down, big flush, Monday-Friday recovery, then Friday pullback from key resistance.
Bulls need to hold or reclaim key support and break key resistance on the daily to gain control.
Without that, bulls are playing a weak hand—short/mid-term bulls need confirmation before committing to longs.
Trading Implications
Take quick profits on longs until resistance is claimed on the daily.
Wait patiently for strong setups at support for long entries.
#ES, #NQ, and #RTY closed green last week, #YM barely red— hence no strong bearish lean yet.
Bears need failed support levels and rejection on retests to confirm downside continuation.
If a gap down, bears want to see follow-through; otherwise, bulls regain short-term control.
Key Reminders:
Always protect your profits and have a plan ready in case the market does the unexpected (it often does, right?).
I stick to trading level by level, as outlined below.
Events Calendar :
Quick Summary:
#ES Bullish above 6043, Bearish below 6020
Bulls weak < 6108
Claiming 6108/39 - key for bullish continuation
#NQ Bullish above 21530, Bearish below 21430
Bulls weak < 21925
Claiming 21850/970 - key for bullish continuation
#RTY Bullish above 2285, Bearish below 2265
Bulls weak < 2336
Claiming 2333/36 - key for bullish continuation
#YM Bullish above 44410, Bearish below 44350
Bulls weak < 44970
Claiming 44970/45155 - key for bullish continuation
#SI Bullish above 32.05, Bearish below 31.81
Bulls weak < 32.90
Still 31.75, 31.57 key support for bulls to hold in any pullbacks else 31.25, 31*, 30.58- in play
As long 32.05 holds/reclaimed, 32.85/32.90, 33.15, 33.35, 33.575*, 34*, 34.60+ in play
Bulls lose control 32 → 31.55 → 30.94 → 30.56
#GC Bullish above 2874, Bearish below 2870
In case of deeper pullback, bulls must defend 2857 to bring back 2892, 2910, 2923, 2952, 3000+ in play
If 2870 fails, 2857*, 2846*, 2830, 2825- in play
Bulls lose control step by step 2830 → 2795 → 2770 → 2735
#PL Bullish above 1008, Bearish below 998
Bulls weak < 1045
As long 1003/998 holds, 1024/28, 1035*, 1045*, 1060/65, 1072*+ in play
If 998 fails, 991*, 979*, 971*/965, 957*, 951- in play
979 last level for bulls to defend to keep last month's move in play
Bears lose control step by step 1024 → 1036 → 1047 → 1065*
#PA Bullish above 966, Bearish below 959
Bulls weak < 1070
If 966 holds, 1005/15, 1020/25*, 1050, 1063*, 1070, 1080*+ in play
If 959 fails, 951/944*, 937/934*, 928*, 918- in play
Bears lose control step by step 1005 → 1025 → 1063 → 1080*
1120/50 are key resistance for bulls to claim and hold to confirm reversal of multi year downtrend
#CL Bullish above 70.42, Bearish below 70.12
Bulls weak < 73.35
As long 70.42 holds, 71.35*, 71.66, 71.85*, 72.10, 72.76*, 73.20/73.35*, 74, 74.55+ in play
If 70.12 fails, 69.80, 69.60*, 69.4/69.25*, 69*, 68.45*- in play
Bears lose control step by step 71.85 → 73.35 → 75.20 → 76.45
After 3 strong red weeks, bulls have a chance to keep move the from Dec in play
Quick Plays:
#ES:
Key Levels Recap:
Last week, 6032 / 5994 were key weekly supports—bulls held and reclaimed them.
For the third week in a row, Friday’s close suggests a possible pullback.
However, support remains nearby.
Current Outlook:
Bulls weak below 6108.
6020/6003 are critical weekly supports—must hold/reclaim to sustain upside.
5945 is the key monthly support.
If 6020 fails, next supports: 5983 → 5968/60 → 5900/5890.
If a red close below 5968, likely downside targets: 5900/5890 → 5865 → 5815.
Ideal Bullish Scenario:
Bulls hold 6043 as support and quickly reclaim 6088/6100, opening the door for 6108 → 6132 → 6144 → 6148 → 6164 → ATH+.*
Ideal Bearish Scenario:
Bears hold 6088/6108 or lower and claim 6043/6020 (hourly/4H red close), bringing 5994 → 5987/83 → 5965 → 5945/5935* → 5900* into play.**
Big Picture:
If 5983 holds/reclaims on daily, targets: 6108 → 6150 → 6248 → 6385+
If 5962 fails on daily, targets: 5890 → 5865 → 5815 → 5745*-
Support Levels:
Intra-day : 6044*, 6031*, 6022/18, 6012, 6003, 5994
Daily : 6043*, 6020, 5983*, 5948/5935*
Weekly : 6003*, 5983*, 5865/5860**
Monthly : 5945*, 5865, 5815/5800, 5745*
Yearly : 5405, 5246, 5005
Resistance Levels:
Intra-day : 6056, 6063/69*, 6075, 6088*, 6100*, 6108/6122*
Daily : 6108/6122, 6148**, 6164/6190*
Weekly : 6122/6132, 6164*, 6248*, 6310
Monthly : 6153/6190, 6248/6260**, 6310
Yearly : 6165/6460*, 6515/6640, 7300
Yearly View
Bullish: As long as 5405/5246 holds, targets 6515, 7300+.
Bearish: If bears hold 6051, targets 5740, 5405, 5330-.
#NQ:
Key Levels Recap:
Sunday’s gap down tested key 20940 support, then recovered and reclaimed 21375/21280 monthly & weekly supports by Monday.
As noted last week, above 21460, bulls had a chance to test 21940/22020—they reached 21968 high but failed to reclaim, leading to a sharp pullback.
Support is still holding, but barely.
Current Outlook:
Bulls weak below 21850.
21200 is a critical weekly/monthly support—must hold to sustain upside momentum.
Above 21530, bulls can test & reclaim 21970/22020/22090+.
Key for bullish continuation: Reclaiming 21850/21970.
If 21200 fails, next supports: 20980 → 20940 → 20875 → 20675 → 20500.**
So far, price action remains sideways within the 20940-22060 range.
A daily/weekly close below 20940 could trigger a multi-week downtrend, targeting 20500 → 20380 → 20010 → 19900.**
Ideal Bullish Scenario:
Bulls defend 21560/21530 and quickly reclaim 21730/21775 to resume upside toward 21850 → 21970 → 22020 → 22290*+
Ideal Bearish Scenario:
If 21430 fails, next downside targets: 21360 → 21300 → 21240 → 21210 → 21130 → 20095*-
Big Picture:
If 21530 holds or is reclaimed, targets: 21915 → 21970 → 22090 → 22310 → 22650+
If 21430 fails, targets: 21375 → 21240 → 21200 → 21170 → 20970*-
Support Levels:
Intra-day : 21560/21530*, 21500/21480*, 21430*, 21360*, 21315*
Daily : 21430*, 21200/21110**, 20970/20900*
Weekly : 21200*, 20940/20875*, 20675/20500**
Monthly : 21210*, 20940*, 20070/20010**
Yearly : 19650/19500*, 18590/18400*, 17465
Resistance Levels:
Intra-day : 21625/21670, 21730, 21805*, 21850, 21915, 21970*
Daily : 21850*, 21970*, 22020/22090*, 22310, 22415*
Weekly : 21770/21970*, 22090*, 22425*, 22760
Monthly : 22060, 22425/22525, 23230
Yearly : 22060/22310, 22650/23610, 24620/26700
Yearly View
Bullish: As long as 19500/18400 holds, targets 23600, 24620, 26700, 27800+.
Bearish: If bears hold 22060/22310, targets 5740, 5405, 5330-.
#RTY:
Key Levels Recap:
Bulls needed to hold 2280 or at least 2275 to maintain momentum.
Sunday night flush briefly dropped below 2275 but recovered quickly, keeping the bullish path intact.
Tested key 2336 resistance, but failed to reclaim—2nd week in a row showing bulls lack strength at key resistance.
Current Outlook:
Bulls remain weak below 2336.
Holding 2259 suggests one more attempt at 2333/2336 is likely.
A trend move requires either 2274 failing or 2333/36 claiming.
Key supports: 2274 (weekly), 2259 (monthly).
Ideal Bullish Scenario:
Bulls defend 2285, then quickly claim 2320/2333 to target 2346 → 2363 → 2383+.
A close above 2336 on the hourly/4-hour chart confirms strength and reinforces upside momentum.
Ideal Bearish Scenario:
Bears hold 2321 and quickly push below 2284 (hourly/4-hour red close) to bring 2265 → 2261 → 2258 → 2252 → 2243** into play.
Big Picture:
If 2285 holds & 2333 is reclaimed on daily, targets: 2363 → 2386 → 2395+
If 2275 fails on daily, targets: 2261 → 2258 → 2236 → 2214 → 2196*-
Support Levels:
Intra-day : 2285/2282*, 2266*, 2261, 2253*, 2245/2243*
Daily : 2283*, 2247/2235*, 2209, 2197*
Weekly : 2265/2258**, 2247/2235*, 2197*
Monthly : 2258/2251*, 2195/2181*, 2068/2033*
Yearly : 2194/2181*, 2058*, 1972*
Resistance Levels:
Intra-day : 2296*, 2311, 2321*, 2327, 2333*
Daily : 2313, 2333/2336**, 2346, 2364*
Weekly : 2336*, 2373*, 2390/2400, 2431
Monthly : 2336*, 2445, 2468*, 2560*
Yearly : 2463, 2615/2756, 3000
Yearly View
Bullish: As long as 2181/2058 holds or is reclaimed, targets 2315, 2463, 2615/2756+.
Bearish: If bears hold 2315/2445, targets 2081*, 2058*, 1972, 1916-.
#YM:
Key Levels Recap:
Last week, bulls needed to defend 44,310 and reclaim 44,475 same day to sustain bullish momentum.
Sunday night drop to 43,965 was quickly recovered, reclaiming 44,310 and 44,475 the same day, allowing bulls to test December highs.
Pulled back from highs to retest key 44,360/44,310 support.
Current Outlook:
After hitting December highs on Thursday, dropped 750+ points closing in red.
Bulls remain weak below 44,970.
Bulls must defend 44,350/44,310 and recover 44,625 same day to maintain bullish momentum.
A red day close below 44,310 could extend selling pressure.
If 44,195 fails on daily, 43,680/43,345 comes into play.
Key weekly support: 44,360/44,310
Key monthly support: 43,345
Ideal Bullish Scenario:
Bulls hold 44,410/44,350 and reclaim 44,625* to resume testing 44,750 → 44,970 → 45,070 → 45,155*+**
A close above 44,970 on hourly/4-hour charts strengthens upside momentum toward 45,075 → 45,225 → 45,355 → 45,700+
Ideal Bearish Scenario:
Bears defend 44,625/44,750/44,970 and push below 44,310 (hourly/4-hour red close) to bring 44,070 → 43,965 → 43,845- into play.
Big Picture:
If 44,310 holds/reclaims on daily, targets: 44,750 → 44,970 → 45,155 → ATH+
If 43,310 fails on daily, targets: 42,810 → 42,750 → 42,200 → 41,970-
Support Levels:
Intra-day: 44,410, 44,360, 44,310, 44,070*
Daily: 44,310*, 44,240/44,165*, 44,000
Weekly: 44,310*, 44,000*, 43,680*
Monthly: 43,345/43,320*, 42,940/42,810*, 41,970/41,790**
Yearly: 40,330/41,260*, 40,100/39,335, 37,900
Resistance Levels:
Intra-day: 44,525, 44,625*, 44,750*, 44,840, 44,960*
Daily: 44,790/44,970*, 45,045/45,155*, 45,355
Weekly: 44,850, 45,155*, 45,355, 45,600
Monthly: 45,155, 45,355, 45,900, 47,440
Yearly: 45,050, 46,975, 48,050, 49,685
Yearly View
Bullish: As long as 41790/40100 holds or is reclaimed, targets 45050, 46975, 48050, 49685+.
Bearish: If bears hold 44485/45050, targets 41790/40100/37870-.
Here’s my cheat sheet for spotting trend changes:
Uptrend to Downtrend:
Fail key support levels.
Reject first support in back tests.
Sell-the-rally mania.
Breakdowns with staying power.
Form lower highs & lows.
Downtrend to Uptrend:
Claim key resistance levels.
Hold second support in pullbacks.
Buy-the-dip frenzy.
Breakouts with staying power.
Form higher highs & lows.
Signs of Shifting to Sideways Action:
Breakouts or breakdowns often lack follow-through.
Alternating highs and lows on lower time frame.(no clear higher/lower highs & lows)
Prices consolidate in narrow ranges: 30-50 points for #ES, 100-150 points for #NQ.
Test and hold key levels, then test and reject resistance (or vice versa).
Intra-day dips into support or resistance quickly reclaimed.
Note - Trend change begins on the lower time frame.
Guidelines for Entry Confirmation
Candle Close Rules:
Intraday: Confirm breakouts/failures with 15m/hourly candle close at intraday levels.
Daily: Confirm with hourly/4-hourly candle close at daily levels.
Weekly: Confirm with daily candle close at weekly levels.
Handling Breakouts:
High Probability of Initial Failure:
Be prepared to lose the first breakout trade if it reverses.
Use the next reversal candle for a quick switch to short if risk reward is at least 1:2.
Second attempts at breakout levels are likely more successful.
Better Entries: After a failed breakout, often you get a better long entry at the next support level when price reverses upward.
Typical Stop Loss Examples:
#ES_F:
Intraday Trades: Use a 3-5 point SL with a minimum 10-point target.
Swing Trades: Use a 10-15 point SL with a minimum 30-point target.
#NQ_F:
Intraday Trades: Use a 20-25 point SL with minimum 40-50 point target.
Swing Trades: Use a 30-35 point SL with minimum 60-80 point target.
Always maintain a minimum 1:2 risk/reward ratio with targets.Intraday trades focus on quicker moves, while swing trades aim for larger targets.Use partial exits for scaling out and securing profits while leaving room for extended targets.Stick to stop-loss levels to manage risk.Avoid over-trading; wait for clear setups.Monitor price action at key levels for confirmation.Be flexible and reenter only if conditions realign after a failure.
What does bear pressure or bulls weak below a level means?
More Sell the rally (STR) than Buy the dip (BTD) until claimed on a higher time frame.
Trading Time frames: Candle close above
Intraday: 1 or 4 hrly
Short-term: Daily
Long-term: Weekly
Note about Terminology:
In my weekly reports and X (Twitter) posts, I often refer to terms like "must hold," "claim," or "fail." Here's a quick explanation of what these terms mean:
For intraday analysis: I consider the 15-minute or 1-hour candle close.
For trades spanning overnight to two days: I focus on the 4-hour candle close.
For a weekly or longer-term outlook: I rely on the daily candle close.
close above: claimed / close below: failed
These references are also available in the pinned thread on my X profile. I strongly recommend reading this thread for a deeper understanding of my chart analysis. If I get lot more subscribers and engagement, I plan to elaborate on my methodology in a separate Substack post in the future, the pinned thread on my X profile offers valuable insights for now.
Read this thread on X to learn about my chart reading method and examples of hold/fail/claim/reject setups for trade execution
Curious about your trading experiences. Share your trading moves inspired by this newsletter – the wins, the almost-wins, and the lessons learned. Drop your insights in the comments below or over on X (formerly Twitter). Let's learn and grow together!
Be nimble and adjust your strategies according to market conditions and the mentioned support and resistance levels. Monitor flag levels for early signs of bias shifts. If you're not following me on X @trdnvestor , consider doing so for daily updates.
Wish you a great trading week!
Disclaimer: This is NOT financial advice. I am NOT a financial advisor.
Thank you, as always