
Weekly Charts Reading for 2/03- 2/07
Icy Roads, Choppy Charts

Keeping this newsletter short and sweet—but I think you’ll find it actionable and helpful for your trading!
As always, I appreciate your likes, shares, and restacks on Substack and X.
Your feedback helps me know if I'm adding value to your trading.
Given the abundance of numbers in this newsletter, there's a chance I might make a typo. If you spot any errors, please give me a heads up. Thanks a bunch!
Note about levels above ATH
Upside targets are estimated without left-side confirmation on the chart, utilizing a combination of Fibonacci and trend lines across multiple time frames. Feel free to reach out if these levels prove effective; otherwise, your understanding is appreciated.
These levels are subject to refinement as prices evolve throughout the days.
In the event of new highs, prioritizing profit-taking based on risk-to-reward multiples is recommended, rather than waiting for specific target levels to be reached.
How’s last week?
Last week, I warned in a tweet and newsletter about volatility and wild swings—markets delivered!
After Sunday night's sharp flush, Monday recovered key support and kept climbing.
Had some opportunities to catch the part of the move but needed quick profit take & wider stop loss resulting in smaller position size.
#YM stole the show, rebounding off key support from last week and hitting a new ATH as expected.
Metals shined—#GC, #PL, #PA, and #SI all had strong moves.
#CL stayed weak, failing to reclaim last week's key resistance level but holding monthly support at 71.85—giving bulls one more shot.
Read here how I use this Weekly Newsletter in my daily trading.
Feel free to scroll down to the end of the report to get a rundown on some of the terms I’m throwing around, like “hold”, “claim”, and “fail”
Disclaimer: This is NOT financial advice. I am NOT a financial advisor.
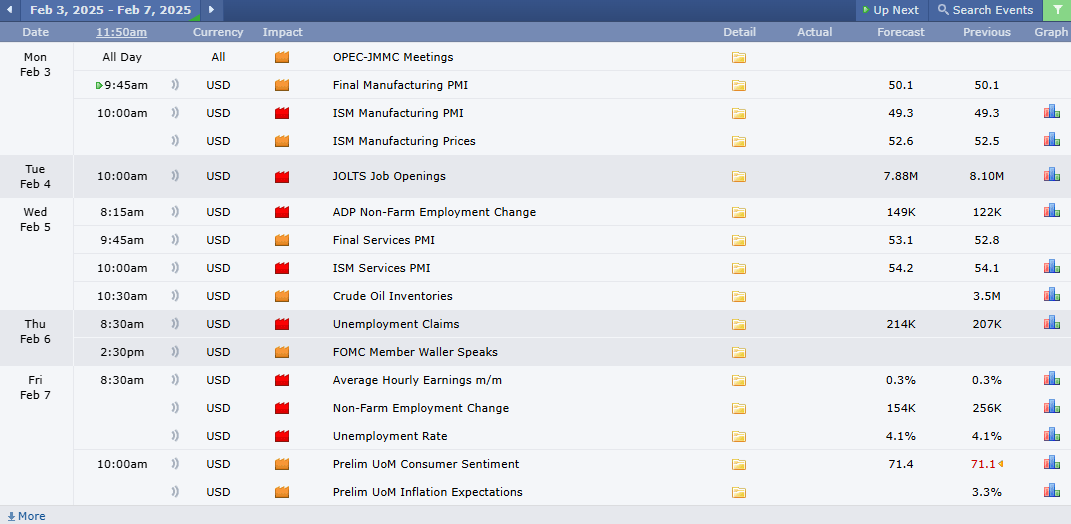
Week Ahead (2/03 – 2/07)
Another busy week ahead with economic reports Monday through Friday—Friday's NFP/Unemployment data could bring extra volatility.
Earnings season heats up with major reports from $GOOGL, $AMZN, $LLY, $AZN, $NVO, $DIS, plus $RBLX, $MRK, $PFE, and more.
Plenty of catalysts to keep volatility high.
Key Levels for a Gap Down & Fast Flush
Watching these levels for potential long setups on lower timeframes—stick to quick level-to-level profit-taking until a daily green close confirms bullish intent.
#ES: 6032, 6007, 5968
#NQ: 21340/300, 21160, 20980
#YM: 44360/310, 43680, 43345
#RTY: 2275, 2261/58, 2236
Fast flush below these levels & snap recovery / reclaim of these levels could signal bullish intent. More detailed levels in the sections below.
Key Reminders:
Always protect your profits and have a plan ready in case the market does the unexpected (it often does, right?).
I stick to trading level by level, as outlined below.
Events Calendar :
Quick Summary:
#ES: Bullish above 6063, Bearish below 6055
Bulls weak < 6107
Claiming 6107/39 - key for bulls to continuation
#NQ: Bullish above 21550/520, Bearish below 21460
Bulls weak < 21780
Claiming 21780/925 - key for bulls to continuation
#RTY: Bullish above 2285, Bearish below 2275
Bulls weak < 2336
Claiming 2333/36 - key for bulls to continuation
#YM: Bullish above 44635, Bearish below 44220
Bulls weak < 45075
Claiming 45075 - key for bulls to continuation
#SI: Bullish above 31.92, Bearish below 31.57
After 3 weeks of multiple attempts, last week claimed 31.65 so 31.57 & 31 marks key support for bulls to hold in any deeper pullbacks
32.85, 33, 33.35, 34, 34.60+ in play as long 31.92 holds/reclaimed
#GC: Bullish above 2828, Bearish below 2824
Bulls weak < 2852
Bulls need to quickly claim 2835, 2847/52* and 2857 to bring 2875/2890/2905/2952+ in play
As long bears hold 2852, 2811, 2798/95, 2785, 2772- in play
2735 key monthly support bulls must defend / reclaim to continue upside move
Bulls lose control step by step on daily 2795 → 2770 → 2735
#PL: Bullish above 1025, Bearish below 1023
As long 1036/25 holds, 1060/65, 1072, 1090*/95*+ in play
If 1023 fails, 1008, 1004/1000, 995*, 980- in play
As wrote for many weeks now price is coiling between 900–1090 for months; breakout or breakdown needed for bigger moves
#PA: Bullish above 1029, Bearish below 1018
Last week bulls needed to hold 967 to keep 1046/50+ in play. Tuesday's quick dip to 959 & recovery of 967 & 976 was failed breakdown and it moved up about 11% in next couple of days
As long bulls hold 1031/29, 1080, 1120, 1150+ in play
1120/50 are next key resistance for bulls to claim and hold to confirm reversal of multi year downtrend
#CL: Bullish above 73, Bearish below 73
Bulls weak < 75.20
71.85 monthly support
As long 73 holds, 74, 74.55, 75.20*, 76+ in play
If 73 fails, 72.15/72, 71.85*, 71.15, 70.45- in play
Bulls need to claim 75.20 to bring 76.5/76.85/77.45+ in play
bears lose control step by step 75.20 → 76.45 → 77.85
Quick Plays:
#ES:
Current Outlook:
Bulls weak < 6107
Note 6032/5994 are weekly supports bulls must hold / reclaimed to continue upside move
5945 key monthly support
If 6032 fails, 5995 next. If that fails 5938 / 5865- in play
If red day close below 6100/6087, 6032*/5995- likely target.
Ideal Bullish Scenario:
Bulls hold 6063/55 as support and quickly reclaim 6107 to bring 6144/48/64*/90+ in play
Ideal Bearish Scenario:
Bears hold 6083/88 or below & quickly claim 6063/55 (hourly/4hr red candle close below) to bring 6032/6012/5994- in play.
Big Picture:
If 6063/6032 holds/reclaimed on daily, 6106/6132*/6164/6192*/6248+ in play
If 6032 fails to hold on daily, 5994*/5968*/48/38*- in play
Support Levels:
Intraday: 6063, 6055*/45, 6038/32*, 6023
Daily: 6055*, 6012/07*, 5994*/74
Weekly: 6032*, 5968*, 5948/38*, 5865*
Monthly: 5945*, 5900*/5865, 5800, 5745
Yearly: 5405, 5246, 5005
Resistance Levels:
Intraday: 6072, 6084/88*, 6107*/18, 6139*/44*
Daily: 6106*, 6148*, 6164/90*
Weekly: 6106/32, 6164*, 6248*, 6310
Monthly: 6153*/90, 6248/6260*, 6310
Yearly: 6165/6460*, 6515/6640, 7300
Yearly View
Bullish: As long as 5405/5246 holds, targets 6515, 7300+.
Bearish: If bears hold 6051, targets 5740, 5405, 5330-.
#NQ:
Current Outlook:
Bulls weak < 21780
Above 21460, bulls have chance to test & reclaim 21940/22020
Claiming 21940 is key for bullish continuation
Note 21375/280 are weekly & monthly supports bulls must hold to continue upside move
If 21280 fails, 20980/940/885*- in play
So far looks like sideways action between 20940-22060 range
If day/week closes below 20940, could start multi week downtrend which likely to bring 20010/19900/19500- in play
Ideal Bullish Scenario:
Bulls defend 21520/460 and quickly reclaims 21595/660 & 21780 resume testing 21940/22020/22290/22310+.
Ideal Bearish Scenario:
Bears hold 21660/21780 & quickly claim 21460 (hourly/4hr red candle close below) to bring 21375/300/280/210/130/095*- in play
Big Picture:
If 21550 holds or reclaimed, 21925/940/22090/310/650+ in play
If 21460 fails, 21375/280/130/095/20910*- in play
Support Levels:
Intraday: 21550/520, 21460, 21425/380*
Daily: 21340/280*, 21160*, 20970*/900
Weekly: 21375*, 21030*, 20940/875*
Monthly: 21210*, 20940*, 20070*/20010*
Yearly: 19650/500*, 18590/18400*, 17465
Resistance Levels:
Intraday: 21595, 21660, 21780*, 21915/940*
Daily: 21940, 22020/090*, 22310, 22415*
Weekly: 21940/22090*, 22425*, 22760
Monthly: 22060, 22425/525, 23230
Yearly: 22060/22310, 22650/23610, 24620/26700
Yearly View
Bullish: As long as 19500/18400 holds, targets 23600, 24620, 26700, 27800+.
Bearish: If bears hold 22060/22310, targets 5740, 5405, 5330-.
#RTY:
Current Outlook:
Bulls weak < 2336
Looks like sideways action / coiling between 2287-2333 range
Either 2275 fails or 2336 claimed to see trend move
These being key levels, quite possible to see false breakdowns or breakouts ?
How to know it's false breakout or breakdowns? If price reverses next day or so and closes below the breakout candle or closes above breakdown candle
2275 key support for the week.
2258 key support for the month
Ideal Bullish Scenario:
Bulls defend 2291/85 and quickly claim 2333 to target 2346, 2363 and 2383+
A close above 2336 on the hourly or 4-hour chart would show stronger commitment and reinforce the bullish move.
Ideal Bearish Scenario:
Bears hold 2298/2305 & quickly claims 2284 (hourly/4hr red candle close below) to bring 2275/61- in play.
A bounce from 2275 and reject of 2286/88 would be bearish to continue below 2258/51*-
Big Picture:
If 2285 holds & 2333 claimed on daily, 2363/2386/95+ in play
If 2275 fails to hold on daily, 2261/58/36*/14/2196- in play
Support Levels:
Intraday: 2291*, 2285/82*, 2275, 2269
Daily: 2274*, 2261/58*, 2241/36*
Weekly: 2285/75*, 2258*, 2236, 2197*
Monthly: 2258*/51, 2194/2181*, 2068/2033*
Yearly: 2194/2181*, 2058*, 1972*
Resistance Levels:
Intraday: 2298/2305, 2314, 2228, 2333*
Daily: 2314, 2333*/36*, 2346, 2364*
Weekly: 2336*, 2373*, 2390/2400, 2431
Monthly: 2336*, 2445, 2468*, 2560*
Yearly: 2463, 2615/2756, 3000
Yearly View
Bullish: As long as 2181/2058 holds or is reclaimed, targets 2315, 2463, 2615/2756+.
Bearish: If bears hold 2315/2445, targets 2081*, 2058*, 1972, 1916-.
#YM:
Current Outlook:
Only index which made ATH last week Friday
But quickly gave away 500pts to close in red
Bulls weak < 45075
Bulls must defend 44360/310 in case of quick drop & recover 44475 same day to keep bullish momentum
Red day close below 44310 could bring in more days
If 44195 fails on daily, 43680/43345- in play
44360/310 key weekly support
43345 is key monthly support
Ideal Bullish Scenario:
Bulls holds 44665/635 and reclaim 45075 to resume testing 45225, 45355, 46000+
A close above 44850 on the hourly and 4-hour chart shows intention to test 45045/075/225
Ideal Bearish Scenario:
Bears defend 44790/44850/45045 and claims 44635 to hold (hourly/4hr red candle close below) to bring 44280/44210/44095- in play
Big Picture:
If 44310 holds/reclaimed on daily, 44790/850/45075/ATH+ in play
If 43320 fails to hold on daily, 42810/750/200/41970- in play
Support Levels:
Intraday: 44665/635*, 44505, 44440*, 44280
Daily: 44440*, 44310*, 44240/165*, 44000
Weekly: 44475, 44360/310*, 44000, 43680*
Monthly: 43345/320, 42940/810*, 41970**/41790*
Yearly: 40330*/41260, 40100/39335, 37900
Resistance Levels:
Intraday: 44790, 44850*, 45045/075*, 45170
Daily: 45120/155*, 45355, 45600
Weekly: 44810, 45155*, 45355
Monthly: 45155, 45355, 45900, 47440
Yearly: 45050, 46975, 48050, 49685
Yearly View
Bullish: As long as 41790/40100 holds or is reclaimed, targets 45050, 46975, 48050, 49685+.
Bearish: If bears hold 44485/45050, targets 41790/40100/37870-.
Here’s my cheat sheet for spotting trend changes:
Uptrend to Downtrend:
Fail key support levels.
Reject first support in back tests.
Sell-the-rally mania.
Breakdowns with staying power.
Form lower highs & lows.
Downtrend to Uptrend:
Claim key resistance levels.
Hold second support in pullbacks.
Buy-the-dip frenzy.
Breakouts with staying power.
Form higher highs & lows.
Signs of Shifting to Sideways Action:
Breakouts or breakdowns often lack follow-through.
Alternating highs and lows on lower time frame.(no clear higher/lower highs & lows)
Prices consolidate in narrow ranges: 30-50 points for #ES, 100-150 points for #NQ.
Test and hold key levels, then test and reject resistance (or vice versa).
Intra-day dips into support or resistance quickly reclaimed.
Guidelines for Entry Confirmation
Candle Close Rules:
Intraday: Confirm breakouts/failures with 15m/hourly candle close at intraday levels.
Daily: Confirm with hourly/4-hourly candle close at daily levels.
Weekly: Confirm with daily candle close at weekly levels.
Handling Breakouts:
High Probability of Initial Failure:
Be prepared to lose the first breakout trade if it reverses.
Use the next reversal candle for a quick switch to short if risk reward is at least 1:2.
Second attempts at breakout levels are likely more successful.
Better Entries: After a failed breakout, often you get a better long entry at the next support level when price reverses upward.
Typical Stop Loss Examples:
#ES_F:
Intraday Trades: Use a 3-5 point SL with a minimum 10-point target.
Swing Trades: Use a 10-15 point SL with a minimum 30-point target.
#NQ_F:
Intraday Trades: Use a 20-25 point SL with minimum 40-50 point target.
Swing Trades: Use a 30-35 point SL with minimum 60-80 point target.
Always maintain a minimum 1:2 risk/reward ratio with targets.Intraday trades focus on quicker moves, while swing trades aim for larger targets.Use partial exits for scaling out and securing profits while leaving room for extended targets.Stick to stop-loss levels to manage risk.Avoid over-trading; wait for clear setups.Monitor price action at key levels for confirmation.Be flexible and reenter only if conditions realign after a failure.
What does bear pressure or bulls weak below a level means?
More Sell the rally (STR) than Buy the dip (BTD) until claimed on a higher time frame.
Trading Time frames: Candle close above
Intraday: 1 or 4 hrly
Short-term: Daily
Long-term: Weekly
Note about Terminology:
In my weekly reports and X (Twitter) posts, I often refer to terms like "must hold," "claim," or "fail." Here's a quick explanation of what these terms mean:
For intraday analysis: I consider the 15-minute or 1-hour candle close.
For trades spanning overnight to two days: I focus on the 4-hour candle close.
For a weekly or longer-term outlook: I rely on the daily candle close.
close above: claimed / close below: failed
These references are also available in the pinned thread on my X profile. I strongly recommend reading this thread for a deeper understanding of my chart analysis. If I get lot more subscribers and engagement, I plan to elaborate on my methodology in a separate Substack post in the future, the pinned thread on my X profile offers valuable insights for now.
Read this thread on X to learn about my chart reading method and examples of hold/fail/claim/reject setups for trade execution
Curious about your trading experiences. Share your trading moves inspired by this newsletter – the wins, the almost-wins, and the lessons learned. Drop your insights in the comments below or over on X (formerly Twitter). Let's learn and grow together!
Be nimble and adjust your strategies according to market conditions and the mentioned support and resistance levels. Monitor flag levels for early signs of bias shifts. If you're not following me on X @trdnvestor , consider doing so for daily updates.
Wish you a great trading week!
Disclaimer: This is NOT financial advice. I am NOT a financial advisor.