
Weekly Charts Reading for 1/27- 1/31
Winter Winds, Wild Swings?

Keeping this newsletter short and sweet—but I think you’ll find it actionable and helpful for your trading!
As always, I appreciate your likes, shares, and restacks on Substack and X.
Your feedback helps me know if I'm adding value to your trading.
Given the abundance of numbers in this newsletter, there's a chance I might make a typo. If you spot any errors, please give me a heads up. Thanks a bunch!
Note about levels above ATH
Upside targets are estimated without left-side confirmation on the chart, utilizing a combination of Fibonacci and trend lines across multiple time frames. Feel free to reach out if these levels prove effective; otherwise, your understanding is appreciated.
These levels are subject to refinement as prices evolve throughout the days.
In the event of new highs, prioritizing profit-taking based on risk-to-reward multiples is recommended, rather than waiting for specific target levels to be reached.
How’s last week?
Last week played out just as expected, except for RTY's quick Monday night dip, which was a bit deeper than anticipated. However, it instantly reclaimed key support, keeping the bullish continuation intact.
I shared what worked throughout the week on X, so no need to repeat it all here. Check out those posts on X if you're curious!
Read here how I use this Weekly Newsletter in my daily trading.
Feel free to scroll down to the end of the report to get a rundown on some of the terms I’m throwing around, like “hold”, “claim”, and “fail”
Disclaimer: This is NOT financial advice. I am NOT a financial advisor.
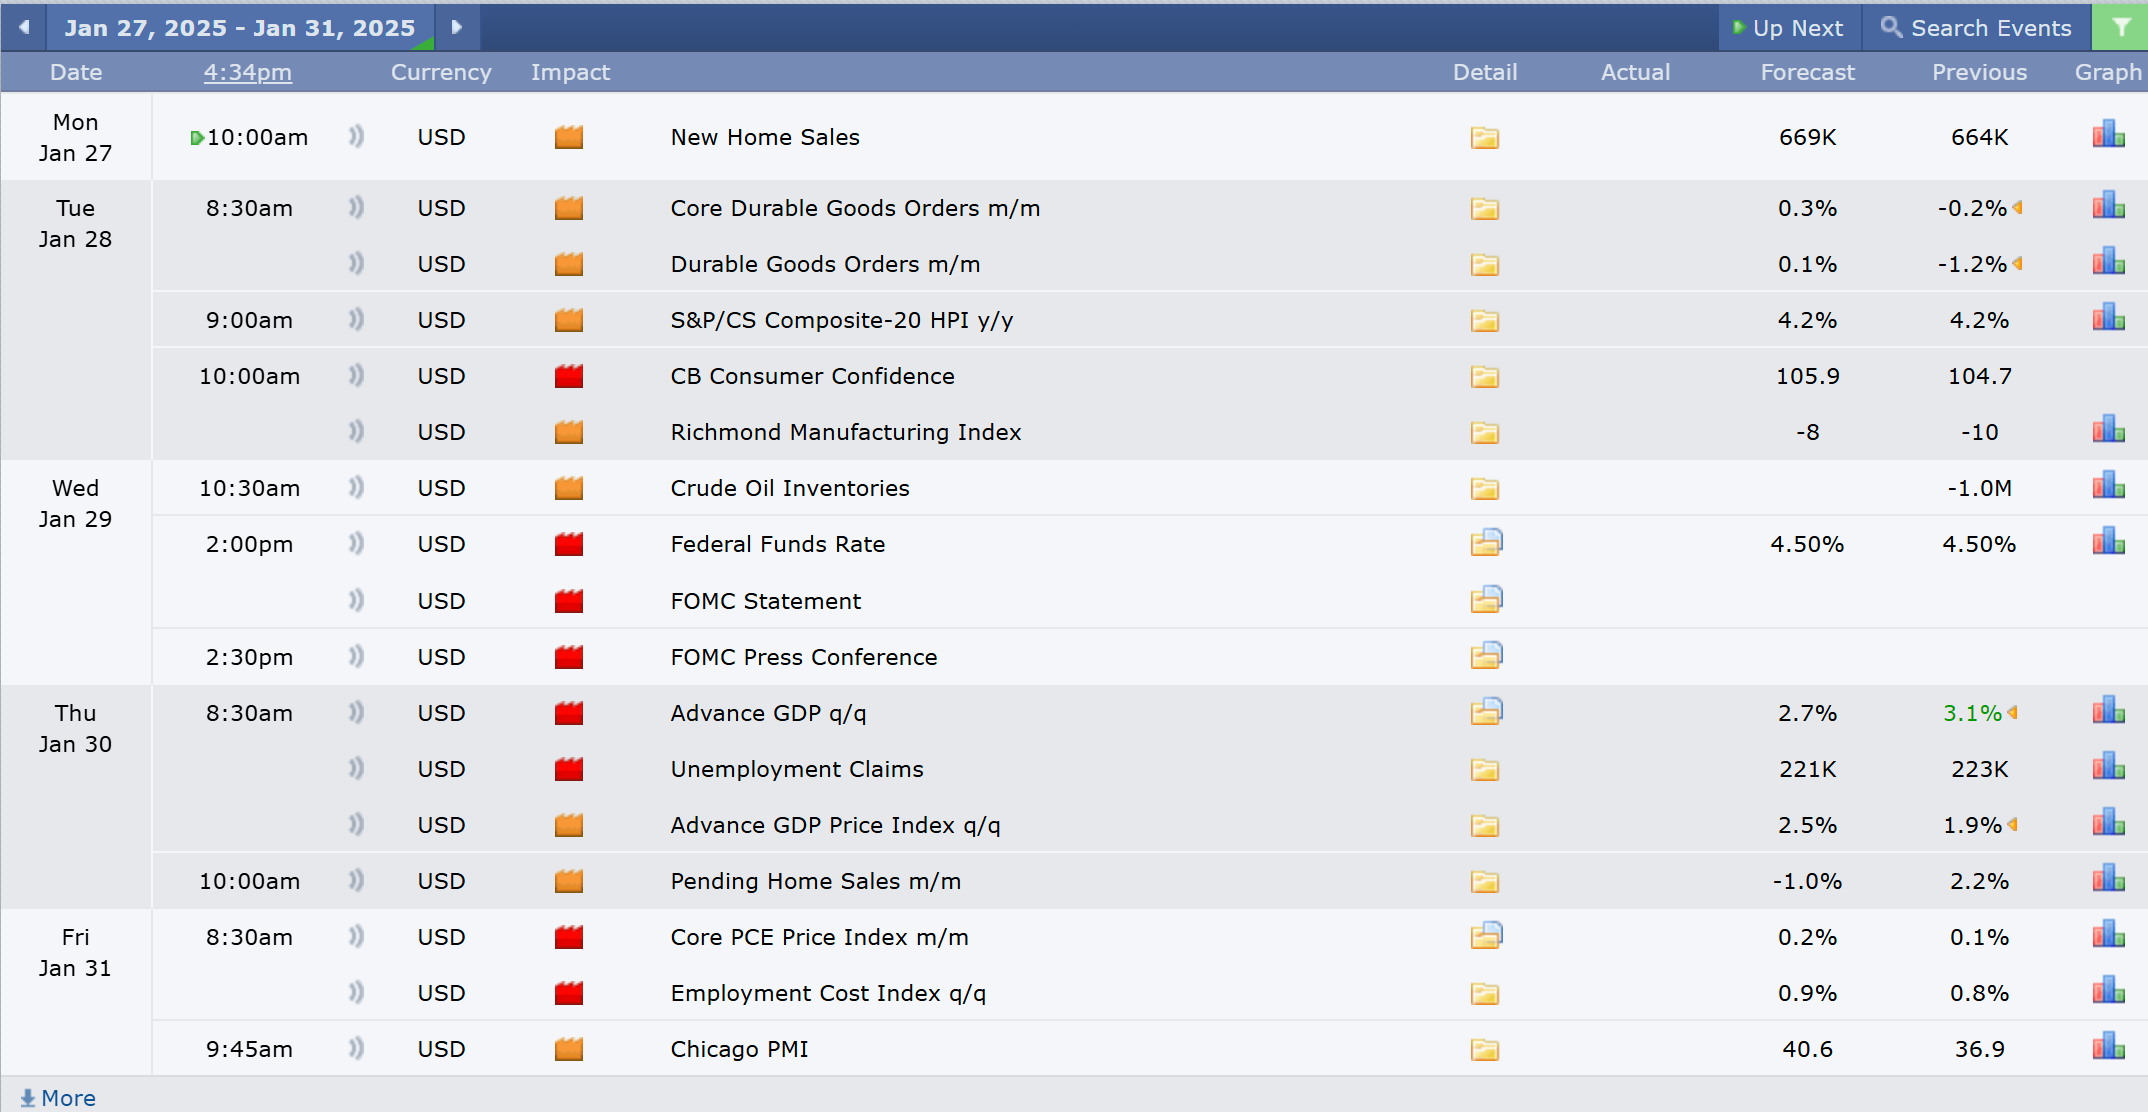
Week Ahead (1/27 – 1/31)
Busy Week Ahead:
Economic reports start with Tuesday's Consumer Confidence, followed by the FOMC rate decision and press conference on Wednesday, GDP/Unemployment Claims on Thursday, and PCE on Friday.
Earnings season is in full swing, with mega caps like $AAPL, $MSFT, $META, $TSLA, $V, $XOM, $MA, $ABBV, $ASML, $SAP, $IBM, and $NOW reporting.
Friday also marks the close of the monthly candle.
Volatility Alert:
Expect a mix of green and red days as markets react to packed events.
This week could test your trading psychology. If you're still working on discipline, it might be better to sit out. Otherwise, stick to your plan.
With increased volatility, manage risk by widening stop losses and reducing position sizes.
Key Market Levels:
#ES and #NQ: Pulled back from key resistance on Friday after strong green moves in recent weeks.
Will the pause turn into a pullback? Bears need to defend resistance and break key support for red days to continue.
Key Bull Levels: In case of a quick flush, bulls must defend Thursday's low (Jan 23) and Wednesday's open (Jan 22) to keep the next leg up in play.
Key Reminders:
Always protect your profits and have a plan ready in case the market does the unexpected (it often does, right?).
I stick to trading level by level, as outlined below.
Events Calendar :
Quick Summary:
#ES:
Bullish above 6125/6120, Bearish below 6115.
Claiming 6150 key for continuation.
#NQ:
Bullish above 21850, Bearish below 21850.
Claiming 22020 key for continuation.
#RTY:
Bullish above 2319/2316, Bearish below 2311.
Claiming 2333/2336 key for continuation.
#YM:
Bullish above 44400, Bearish below 44320.
Claiming 44730 key for continuation.
#SI:
Bullish above 30.85, Bearish below 30.85.
Bulls still weak < 31.65
For 6 days in last 3 weeks attempted to close above key 31.65 but failed
31.40, 31.65, 32.60, 33+ in play as long 30.85 holds/reclaimed
Daily close above 31.65 needed to continuation toward 33/34/35+
#GC:
Bullish above 2770/2761, Bearish below 2756.
Wednesday claimed 2759, hence 2756 last level for bulls to defend
If 2756 fails, could bring 2737/31/22- as back test targets
Bulls control > 2762, & brings 2790/2800/2850+ in play
#PL:
Bullish above 967, Bearish below 966.
Bulls still weak < 995
Bulls need to claim 973/984/995 to keep upside in play if 939 fails, 910- likely retest target
As wrote for many weeks now price is coiling between 900–1090 for months; breakout or breakdown needed for bigger moves.
#PA:
Bullish above 1000, Bearish below 990.
Bulls need to hold 976/967 in case of deeper pullback to keep 1020/1046/1050+ in play
Claiming 1025 would pass control over to bulls
#CL:
Bullish above 74.30, Bearish below 74.12
Bulls weak < 77.90
As wrote last week if 76.54 fails, 74.29/73.30 targets, hit 74.29 (74 low)
Also as tweeted Thursday, key support, bulls listened and tried bounce though closed in weak green candle
Bulls need to claim 75.50/76 to bring 76.5/76.85/77.45+ in play
If 74.12 fails, 73.30/73.10/72.7- in play
bears lose control step by step 75.50 → 77.85 → 77.90
Quick Plays:
#ES:
Key Levels Recap:
Bulls defended support precisely & strong then hit 6155 target.
Friday's close suggests potential for a pullback.
However, key support levels are still intact.
Current Outlook:
Critical Support: 6032 is weekly support that bulls must hold to sustain upside momentum.
If 6032 Fails: Next support at 5995. Below that, 5938 and 5865 come into play.
Two Long Play Scenarios:
Support Hold: Enter long if these levels hold or are reclaimed intraday: 6120/15, 6100, 6090, 6060*, 6032*.
Breakout: Enter long on reclaim of 6150 with a confirmed hourly or 4-hourly candle.
Bearish Signals:
A red daily close below 6100/6087 makes 6032*/5995 likely targets.
Ideal Bullish Scenario:
Bulls maintain support at 6125/20 and quickly reclaim 6150 to target 6180/6192/6220+.
Ideal Bearish Scenario:
Bears defend 6143/50 and secure 6115 with an hourly or 4-hour red candle close below, opening up targets at 6100/6087/6060-.
Big Picture:
If 6060/6032 holds or is reclaimed on a daily timeframe, targets expand to 6105/6153*/6192*/6220/6248+.
If 6087 fails to hold on a daily close, 6032*/5995/5968 become key downside levels.
Support Levels:
Intraday: 6125/20, 6115/07, 6100*.
Daily: 6100, 6060/6032*, 5995*.
Weekly: 6032*, 5968, 5865*.
Monthly: 5900*/5865, 5745/25*, 5656/26*.
Yearly: 5405, 5246, 5005.
Resistance Levels:
Intraday: 6143/50*, 6158, 6167*/72.
Daily: 6180/6192*, 6220*/6248*, 6275.
Weekly: 6164*, 6248*, 6310.
Monthly: 6051, 6153*/90, 6248.
Yearly: 6165/6460*, 6515/6640, 7300
Yearly View
Bullish: As long as 5405/5246 holds, targets 6515, 7300+.
Bearish: If bears hold 6051, targets 5740, 5405, 5330-.
#NQ:
Key Levels Recap:
Bulls held Friday's low, tested 22080 weekly resistance, and pulled back.
Support levels are still holding.
Current Outlook:
Above 21850: Bulls have a chance to test and reclaim 21940/22020.
Key Bullish Level: Claiming 22020 is crucial for continued upside momentum.
If Red Day Closes Below 21850:
Targets: 21765/21590/21480*.
Critical Support: Bulls must defend Thursday's low at 21765, or a deeper drop to 21590/21230 is likely.
Weekly Support: 21580 is a key level bulls must hold to sustain the uptrend.
If 21580 Fails:
Next supports: 21480, 21375, 21230.
Further downside targets: 21090/20940.
Two Long Play Scenarios:
Support Hold: Enter long if the following levels hold or are reclaimed intraday: 21850, 21765*, 21590*, 21230*.
Breakout: Enter long if 22020 is reclaimed with a confirmed hourly or 4-hourly candle.
Ideal Bullish Scenario:
Bulls defend 21850, reclaim 21940 and 22020, and push toward 22290/22310/22650*+.
Ideal Bearish Scenario:
Bears defend 21940/22020 and secure 21850 with an hourly or 4-hour red candle close below, targeting 21770/21695-.
Big Picture:
If 21850 holds or is reclaimed, targets include 22090/22310/22650*/23230+.
If 21850 fails, likely targets are 21770/21695/21630/21590-.
Support Levels:
Intraday: 21850, 21805*, 21770.
Daily: 21765, 21695, 21560.
Weekly: 21375, 21230*, 21090.
Monthly: 20940*, 20070*/20010*, 19800*.
Yearly: 19650/19500*, 18590/18400*, 17465.
Resistance Levels:
Intraday: 21940, 22020, 22090.
Daily: 22165, 22310, 22425.
Weekly: 22090*, 22425*, 22760.
Monthly: 21900, 22425/22525, 23200.
Yearly: 22060/22310, 22650/23610, 24620/26700
Yearly View
Bullish: As long as 19500/18400 holds, targets 23600, 24620, 26700, 27800+.
Bearish: If bears hold 22060/22310, targets 5740, 5405, 5330-.
#RTY:
Key Levels Recap:
Bulls needed to hold 2280 or, at the very least, 2274 to maintain momentum.
On Monday night, price quickly dropped below 2274 but recovered within minutes, setting the stage for continued bullish action.
As noted last week: "If Friday’s low holds, 2305/2310/2314, 2336, and 2364+ are in play."
Sure enough, 2336 was hit (2337 high) on Wednesday before pulling back.
Current Outlook:
Above 2316: Bulls need to reclaim 2333/2336 to push toward 2364+.
If 2311 Fails on 4-Hour Chart:
Targets: 2289/2275 unless 2324/2333 are reclaimed.
Ideal Bullish Scenario:
Bulls defend 2319/2316, quickly reclaim 2333, and target 2346, 2363, and 2383+.
An hourly or 4-hour close above 2336 signals stronger bullish commitment and continuation.
Big Picture:
If 2310 is Reclaimed on Daily Chart: Targets include 2363/2386/2395+. (in play)
If 2181 Fails on Daily Chart: Likely downside to 2133/2101*/2091-.
Support Levels:
Intraday: 2319/2316, 2311, 2302*.
Daily: 2311*, 2287/2275*, 2261*.
Weekly: 2285*, 2258, 2197.
Monthly: 2250, 2194/2181*, 2068/2033*.
Yearly: 2194/2181*, 2058*, 1972*.
Resistance Levels:
Intraday: 2328, 2333/2336, 2346.
Daily: 2346, 2364, 2386*.
Weekly: 2372, 2400, 2431.
Monthly: 2260, 2315*, 2435/2445*.
Yearly: 2463, 2615/2756, 3000
Yearly View
Bullish: As long as 2181/2058 holds or is reclaimed, targets 2315, 2463, 2615/2756+.
Bearish: If bears hold 2315/2445, targets 2081*, 2058*, 1972, 1916-.
#YM:
Key Levels Recap:
Last week, bulls defended 43615/43680 as a quick dip to 43497 was promptly recovered, allowing the bullish momentum to continue and hit the 44750 weekly resistance (44773 high) before pulling back on Friday.
Current Outlook:
Above 44400: Bulls maintain momentum.
Key Resistance to Reclaim: Bulls must reclaim 44750 to continue toward 45000 and all-time highs (ATH).
Critical Daily Support: 44355/44310 is the last line for bulls to defend.
Close Below 44310: A red day close below this level could signal further bearish pressure.
Below 44310: A quick dip to 44195/44165 with a fast recovery of 44320 could reignite a bullish leg.
If 44195 Fails on Daily Chart: 43680/43345 becomes the next downside targets.
Ideal Bullish Scenario:
Bulls defend 44400/44355 and reclaim 44750 to resume testing 44985, 45050, and ATH+.
An hourly or 4-hour close above 44685 signals bullish intent to reclaim 44750.
Big Picture:
If 44310 Holds or Is Reclaimed on Daily Chart: Targets include 44810, 44985, 45050, and ATH+.
If 44195 Fails on Daily Chart: Downside targets include 43680, 43345, and 42800-.
Support Levels:
Intraday: 44530, 44400, 44340*.
Daily: 44310*, 44240/44165*, 43680.
Weekly: 43680*, 43320, 42810.
Monthly: 42810*, 41970/41790*, 40350/40030*.
Yearly: 40330*/41260, 40100/39335, 37900.
Resistance Levels:
Intraday: 44635, 44750*, 44810, 44910.
Daily: 44810, 44985*, 45155*.
Weekly: 44810, 45155*, 45355.
Monthly: 45050/45095, 45355, 47440.
Yearly: 45050, 46975, 48050, 49685
Yearly View
Bullish: As long as 41790/40100 holds or is reclaimed, targets 45050, 46975, 48050, 49685+.
Bearish: If bears hold 44485/45050, targets 41790/40100/37870-.
Here’s my cheat sheet for spotting trend changes:
Uptrend to Downtrend:
Fail key support levels.
Reject first support in back tests.
Sell-the-rally mania.
Breakdowns with staying power.
Form lower highs & lows.
Downtrend to Uptrend:
Claim key resistance levels.
Hold second support in pullbacks.
Buy-the-dip frenzy.
Breakouts with staying power.
Form higher highs & lows.
Signs of Shifting to Sideways Action:
Breakouts or breakdowns often lack follow-through.
Alternating highs and lows on lower time frame.(no clear higher/lower highs & lows)
Prices consolidate in narrow ranges: 30-50 points for #ES, 100-150 points for #NQ.
Test and hold key levels, then test and reject resistance (or vice versa).
Intra-day dips into support or resistance quickly reclaimed.
Guidelines for Entry Confirmation
Candle Close Rules:
Intraday: Confirm breakouts/failures with 15m/hourly candle close at intraday levels.
Daily: Confirm with hourly/4-hourly candle close at daily levels.
Weekly: Confirm with daily candle close at weekly levels.
Handling Breakouts:
High Probability of Initial Failure:
Be prepared to lose the first breakout trade if it reverses.
Use the next reversal candle for a quick switch to short if risk reward is at least 1:2.
Second attempts at breakout levels are likely more successful.
Better Entries: After a failed breakout, often you get a better long entry at the next support level when price reverses upward.
Typical Stop Loss Examples:
#ES_F:
Intraday Trades: Use a 3-5 point SL with a minimum 10-point target.
Swing Trades: Use a 10-15 point SL with a minimum 30-point target.
#NQ_F:
Intraday Trades: Use a 20-25 point SL with minimum 40-50 point target.
Swing Trades: Use a 30-35 point SL with minimum 60-80 point target.
Always maintain a minimum 1:2 risk/reward ratio with targets.Intraday trades focus on quicker moves, while swing trades aim for larger targets.Use partial exits for scaling out and securing profits while leaving room for extended targets.Stick to stop-loss levels to manage risk.Avoid over-trading; wait for clear setups.Monitor price action at key levels for confirmation.Be flexible and reenter only if conditions realign after a failure.
What does bear pressure or bulls weak below a level means?
More Sell the rally (STR) than Buy the dip (BTD) until claimed on a higher time frame.
Trading Time frames: Candle close above
Intraday: 1 or 4 hrly
Short-term: Daily
Long-term: Weekly
Note about Terminology:
In my weekly reports and X (Twitter) posts, I often refer to terms like "must hold," "claim," or "fail." Here's a quick explanation of what these terms mean:
For intraday analysis: I consider the 15-minute or 1-hour candle close.
For trades spanning overnight to two days: I focus on the 4-hour candle close.
For a weekly or longer-term outlook: I rely on the daily candle close.
close above: claimed / close below: failed
These references are also available in the pinned thread on my X profile. I strongly recommend reading this thread for a deeper understanding of my chart analysis. If I get lot more subscribers and engagement, I plan to elaborate on my methodology in a separate Substack post in the future, the pinned thread on my X profile offers valuable insights for now.
Read this thread on X to learn about my chart reading method and examples of hold/fail/claim/reject setups for trade execution
Curious about your trading experiences. Share your trading moves inspired by this newsletter – the wins, the almost-wins, and the lessons learned. Drop your insights in the comments below or over on X (formerly Twitter). Let's learn and grow together!
Be nimble and adjust your strategies according to market conditions and the mentioned support and resistance levels. Monitor flag levels for early signs of bias shifts. If you're not following me on X @trdnvestor , consider doing so for daily updates.
Wish you a great trading week!
Disclaimer: This is NOT financial advice. I am NOT a financial advisor.