
Weekly Charts Reading for 12/29- 1/03
Season’s Greetings, Bears & Bulls!

Still on holiday mode here, so keeping this newsletter short and sweet—but I think you’ll find it actionable and helpful for your trading!
Key points:
Support and resistance levels are marked with asterisks (*).
If one level is claimed or failed, the next asterisked level comes into play.
Levels in parentheses indicate daily time frame transitions.
If one level in parentheses is claimed or failed, the next level in parentheses comes into play.
I hope this helps you navigate the market effectively.
As always, I appreciate your likes, shares, and restacks on Substack and X.
Your feedback helps me know if I'm adding value to your trading.
Given the abundance of numbers in this newsletter, there's a chance I might make a typo. If you spot any errors, please give me a heads up. Thanks a bunch!
How’s last week?
As mentioned in the Dec 16-20 newsletter, an orange flag triggered for #RTY, #YM, and #ES on Dec 5, 6, and 9, followed by a deeper dive that week.
Last week, the market tried to hold support from the previous week, but weakness returned on Thursday after hitting key resistance levels.
Read here how I use this Weekly Newsletter in my daily trading
Disclaimer: This is NOT financial advice. I am NOT a financial advisor.
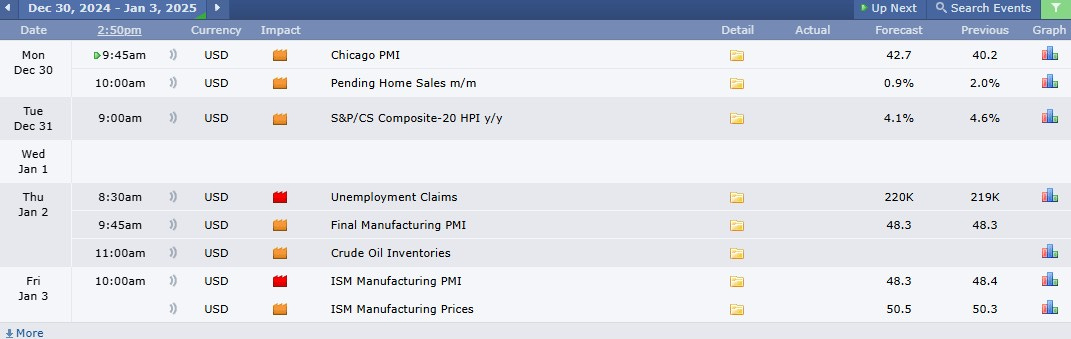
Week Ahead (12/29 – 1/03)
End-of-year candle prints this week.
Wednesday is a holiday for New Year’s.
Short trading week with just a few standard economic reports.
Still expecting enough action to keep volatility alive.
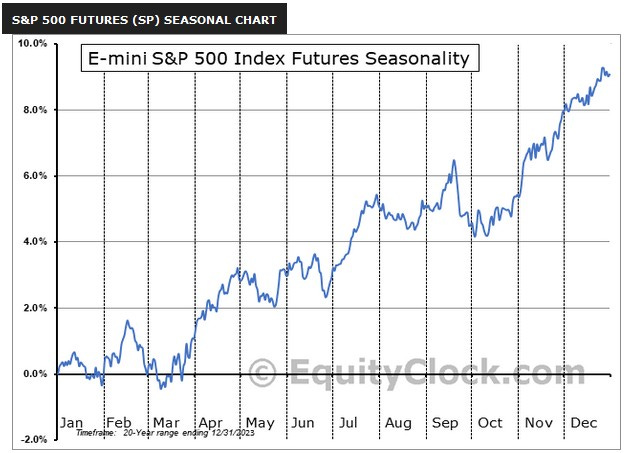
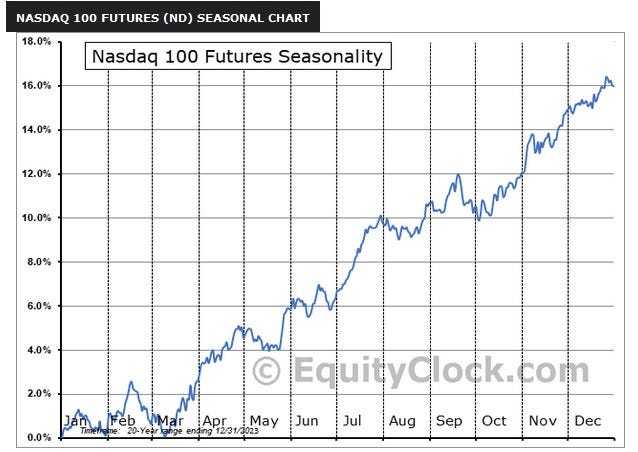
Seasonality Insights:
New year, new month—good time to revisit seasonality charts.
Historically, the latter part of January tends to be weak, but it’s not set in stone.
The market could keep rallying, especially if the recent rally was election-driven, though it might pause during the transition (just my opinion—not a trading plan).
Key Reminders:
Always protect your profits and have a plan ready in case the market does the unexpected (it often does, right?).
I stick to trading level by level, as outlined below.


Quick Summary:
#ES
Bullish above 6005, bearish below 5996/5900.
Bulls weak < 6127.
Bears lose control step by step: 6095 → 6105 → 6127.
#NQ
Bullish above 21700, bearish below 21610.
Bulls weak < 22310.
Bears lose control step by step: 22010 → 22220 → 22310.
#RTY
Bullish above 2247/2245, bearish below 2241.
Bulls weak < 2395.
Bears lose control step by step: 2300 → 2366 → 2395.
#YM
Bullish above 43330/43255, bearish below 43145.
Bulls weak < 44240.
Bears lose control step by step: 43685 → 43970 → 44240.
#SI
Bullish above 29.95, bearish below 29.90.
Bulls weak; need to claim 31.05 to target 32.60/33/33.20+.
#GC
Bullish above 2630/2628, bearish below 2628.
Bulls weak; need to claim 2675 to target 2714/2759+.
#PL
Bullish above 934, bearish below 931.
Bulls weak < 965.
Coiling between 900–1090 for months; breakout or breakdown needed for bigger moves.
#PA
Bullish above 911, bearish below 908.
Bulls weak < 990; need to claim 990 to target 1040/1050+.
#CL
Bullish above 69.6, bearish below 69.4.
Holding $66 monthly support for 4 months—if it fails, expect a larger drop.
Bears lose control step by step: 70.5 → 71.5 → 73.
Weekly close > 76/75.10 needed for sustained bullish momentum.
Quick Plays:
#ES:
Big Picture:
If 6105 is claimed on the daily, targets: 6127 → 6153* → 6185* → 6192*+.
If 5865 fails to hold on the daily, targets: 5745 → 5732-.
Support Levels:
Intra-day: 6027, 6015/05*, 5996/5990.
Daily: 5996, 5945/5930, 5905/5900.
Weekly: 5996, 5965*, 5876.
Monthly: 5900/5865, 5745/5725*, 5656/5626*.
Resistance Levels:
Intra-day: 6045, 6068, 6083.
Daily: 6092/6105, 6127/6153, 6185*/6192*.
Weekly: 6126/6153, 6185*/6192*, 6215*/6250*.
Monthly: 6138*, 6215*/6250*, 6305*.
#NQ:
Bulls weak < 22310.
Bears lose control step by step: 22010 → 22220 → 22310.
Big Picture:
If 21550 holds or is reclaimed, targets: 22300 → 22650* → 23230.
If 21475 fails on the daily, targets: 20510 → 20405-, with intermediate levels to watch at 21000/20940.
Support Levels:
Intra-day: 21700, 21610, 21550/21510.
Daily: 21570/21510, 21305*, 21070.
Weekly: 21550/21475*, 21000*/20940*, 20805/20510*.
Monthly: 21405/21000*, 20070*/20010*, 19815/19650*.
Resistance Levels:
Intra-day: 21750, 21900, 21960/22005.
Daily: 22005/22090*, 22310/22415, 22600*.
Weekly: 22080*, 22525*, 22700/23230*.
Monthly: 22425/22525, 23230*/23610*, 24000.
#RTY:
Big Picture:
If 2300 is claimed on the daily, targets: 2363 → 2386 → 2395+.
If 2245 fails to hold on the daily, targets: 2205 → 2198*-.
Support Levels:
Intra-day: 2263, 2253, 2247/2245.
Daily: 2247/2241, 2230, 2220/2214, 2198-.
Weekly: 2241, 2214*, 2198*.
Monthly: 2205/2198*, 2068/2033*, 1983.
Resistance Levels:
Intra-day: 2266*, 2285*, 2293.
Daily: 2296/2305*, 2364, 2386/2395.
Weekly: 2305*, 2373, 2405*.
Monthly: 2435/2445*, 2463*, 2520/2575*.
#YM:
Big Picture:
If 43710 is claimed on the daily, targets: 43970* → 44150 → 44240* → 44485+.
If 43000 fails to hold on the daily, targets: 42000 → 41970** → 41790-.
Support Levels:
Intra-day: 43330, 43275/43255, 43215.
Daily: 43145, 42570, 42415*/42000*.
Weekly: 42840, 42000*, 41790/41425.
Monthly: 41970**/41790*, 40350*/40030, 39590*.
Resistance Levels:
Intra-day: 43390*, 43510/43590, 43645.
Daily: 43710, 43970*/44150, 44240.
Weekly: 43750, 44315/44485, 44700/44810*.
Monthly: 45095/45675*, 46350*/46960*, 47025*.
Here’s my cheat sheet for spotting trend changes:
Uptrend to Downtrend:
Fail key support levels.
Reject first support in back tests.
Sell-the-rally mania.
Breakdowns with staying power.
Form lower highs & lows.
Downtrend to Uptrend:
Claim key resistance levels.
Hold second support in pullbacks.
Buy-the-dip frenzy.
Breakouts with staying power.
Form higher highs & lows.
Signs of Shifting to Sideways Action:
Breakouts or breakdowns often lack follow-through.
Alternating highs and lows on lower time frame.(no clear higher/lower highs & lows)
Prices consolidate in narrow ranges: 30-50 points for #ES, 100-150 points for #NQ.
Test and hold key levels, then test and reject resistance (or vice versa).
Intra-day dips into support or resistance quickly reclaimed.
Note about levels above ATH
Upside targets are estimated without left-side confirmation on the chart, utilizing a combination of Fibonacci and trend lines across multiple time frames. Feel free to reach out if these levels prove effective; otherwise, your understanding is appreciated.
These levels are subject to refinement as prices evolve throughout the days.
In the event of new highs, prioritizing profit-taking based on risk-to-reward multiples is recommended, rather than waiting for specific target levels to be reached.
Feel free to scroll down to the end of the report to get a rundown on some of the terms I'm throwing around, like "hold," "claim," and “fail”
Events Calendar :
Guidelines for Entry Confirmation
Candle Close Rules:
Intraday: Confirm breakouts/failures with 15m/hourly candle close at intraday levels.
Daily: Confirm with hourly/4-hourly candle close at daily levels.
Weekly: Confirm with daily candle close at weekly levels.
Handling Breakouts:
High Probability of Initial Failure:
Be prepared to lose the first breakout trade if it reverses.
Use the next reversal candle for a quick switch to short if risk reward is at least 1:2.
Second attempts at breakout levels are likely more successful.
Better Entries: After a failed breakout, often you get a better long entry at the next support level when price reverses upward.
Typical Stop Loss Examples:
#ES_F:
Intraday Trades: Use a 3-5 point SL with a minimum 10-point target.
Swing Trades: Use a 10-15 point SL with a minimum 30-point target.
#NQ_F:
Intraday Trades: Use a 20-25 point SL with minimum 40-50 point target.
Swing Trades: Use a 30-35 point SL with minimum 60-80 point target.
Always maintain a minimum 1:2 risk/reward ratio with targets.Intraday trades focus on quicker moves, while swing trades aim for larger targets.Use partial exits for scaling out and securing profits while leaving room for extended targets.Stick to stop-loss levels to manage risk.Avoid over-trading; wait for clear setups.Monitor price action at key levels for confirmation.Be flexible and reenter only if conditions realign after a failure.
What does bear pressure or bulls weak below a level means?
More Sell the rally (STR) than Buy the dip (BTD) until claimed on a higher time frame.
Trading Time frames: Candle close above
Intraday: 1 or 4 hrly
Short-term: Daily
Long-term: Weekly
Note about Terminology:
In my weekly reports and X (Twitter) posts, I often refer to terms like "must hold," "claim," or "fail." Here's a quick explanation of what these terms mean:
For intraday analysis: I consider the 15-minute or 1-hour candle close.
For trades spanning overnight to two days: I focus on the 4-hour candle close.
For a weekly or longer-term outlook: I rely on the daily candle close.
close above: claimed / close below: failed
These references are also available in the pinned thread on my X profile. I strongly recommend reading this thread for a deeper understanding of my chart analysis. If I get lot more subscribers and engagement, I plan to elaborate on my methodology in a separate Substack post in the future, the pinned thread on my X profile offers valuable insights for now.
Read this thread on X to learn about my chart reading method and examples of hold/fail/claim/reject setups for trade execution
Curious about your trading experiences. Share your trading moves inspired by this newsletter – the wins, the almost-wins, and the lessons learned. Drop your insights in the comments below or over on X (formerly Twitter). Let's learn and grow together!
Be nimble and adjust your strategies according to market conditions and the mentioned support and resistance levels. Monitor flag levels for early signs of bias shifts. If you're not following me on X @trdnvestor , consider doing so for daily updates.
Wish you a great trading week!
Disclaimer: This is NOT financial advice. I am NOT a financial advisor.