
Weekly Charts Reading for 1/13- 1/17
Bears leading, Bulls' relief coming?

Keeping this newsletter short and sweet—but I think you’ll find it actionable and helpful for your trading!
Key points:
Support and resistance levels are marked with asterisks (*).
If one level is claimed or failed, the next asterisked level comes into play.
Levels in parentheses indicate daily time frame transitions.
If one level in parentheses is claimed or failed, the next level in parentheses comes into play.
I hope this helps you navigate the market effectively.
As always, I appreciate your likes, shares, and restacks on Substack and X.
Your feedback helps me know if I'm adding value to your trading.
Given the abundance of numbers in this newsletter, there's a chance I might make a typo. If you spot any errors, please give me a heads up. Thanks a bunch!
How’s last week?
Last week kicked off with bullish momentum from Friday and hit a few upside targets.
Monday closed green but failed to close above key resistance levels.
I missed recognizing the rejection at key resistance (like 6051 and 6036) and expected bullish continuation as long as Monday’s open (5995) held.
However, once supports failed, downside plays unfolded and continued hitting targets as identified.
Read here how I use this Weekly Newsletter in my daily trading.
Feel free to scroll down to the end of the report to get a rundown on some of the terms I’m throwing around, like “hold”, “claim”, and “fail”
Disclaimer: This is NOT financial advice. I am NOT a financial advisor.
Week Ahead (1/13 – 1/17)
Tuesday, Wednesday, and Thursday bring the usual economic reports, with PPI, CPI, Retail Sales, and Unemployment Claims on deck.
Ideally, bears test downside targets on Sunday/Monday before we see a stronger relief bounce.
As noted a couple of weeks ago, January tends to be a flat-to-red month. After #RTY, #YM, and #ES closed red in December, the ongoing weakness is no surprise.
Volatility remains high. Months of grinding rallies are getting wiped out in hours or days — classic bear action.
That said, prices are nearing key monthly/weekly support levels identified below, giving bulls a shot at a relief bounce.
Will it happen? No idea. What I do know: If key levels are tested and we get a quick bounce that holds for an hour, 4-hour, or daily close, those levels are likely to stick.
Key Reminders:
Always protect your profits and have a plan ready in case the market does the unexpected (it often does, right?).
I stick to trading level by level, as outlined below.
Events Calendar :
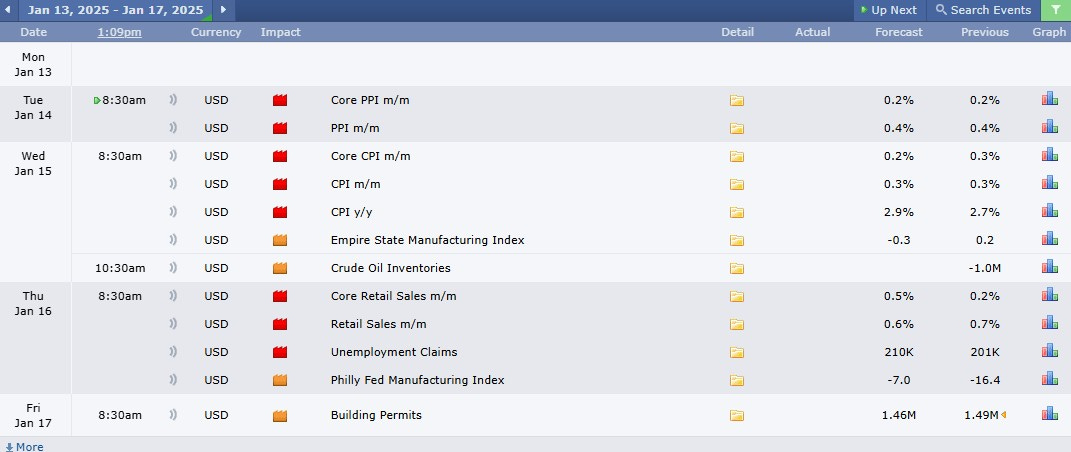
Quick Summary:
#ES
Bullish above 5851, Bearish below 5851
Bears in control below 6068, Bounce Likely if Support Holds
#NQ
Bullish above 20990/940, Bearish below 20900
Bears in control below 21900, Bounce Likely if Support Holds
#RTY
Bullish above 2191, Bearish below 2191
Bears in control below 2310, Bounce Likely if Support Holds
#YM
Bullish above 42150, Bearish below 42150
Bears in control below 43750, Bounce Likely if Support Holds
#SI
Bullish above 31.20/30.15, Bearish below 31.04
Bulls weak below 31.65.
Targets: 31.60, 32.60, 33+ — in play as long as 30.70 holds.
Daily close above 31.65 needed for continuation towards 33/34/35+.
#GC
Bullish above 2711/2704, Bearish below 2684
Bulls control above 2684, with targets: 2714, 2759, 2790, 2850+ in play.
#PL
Bullish above 988/983, Bearish below 977
Wrote for many weeks “Coiling between 900–1090 for months — breakout or breakdown needed for bigger moves.”
Last month's low was 907; now back at 992, targeting 1012/1035/1050/1065+.
#PA
Bullish above 960, Bearish below 953
Bulls weak below 990; need to reclaim 990 to target 1040/1050+.
Last month held 896 as monthly support, with this month’s low at 904, bouncing from there.
Bears lose control step by step: 968 → 990 → 1025.
#CL
Bullish above 76.30/75.75, Bearish below 75.55
Bullish targets 77.5, 78.70, 79.15, 80+
Wrote for many weeks - “Bears lose control step by step: 70.5 → 71.5 → 73”
January 2nd, 73 was reclaimed, and price moved to hit 77.5 target before pulling back.
Weekly close > 76 marks key levels for bulls to defend. Failure to hold open/low of last week could return price to 70/69.4/68.40.
Quick Plays:
#ES:
Key Levels
Below 5940, bears keep momentum from Friday.
Bears control below 6068.
Bears lose control step by step: 5951 → 5975 → 6048*/68.
Targets: 5820/15, 5753, 5735 — in play as long as 5951 holds. Probability of this play decreases as bears reclaim levels above.
Bounce likely from 5820/15 if price dips further before testing 5951.
Big Picture
If 6036/6051 reclaimed on the daily: Targets 6105, 6127, 6153*, 6192*+.
If 5865 fails on the daily: Targets 5745/32 with 5820/15 as intermediate levels.
Support Levels
Intra-day support: 5851, 5841, 5820
Daily support: 5820*, 5755, 5725*
Weekly support: 5855, 5750/40, 5675/65
Monthly support: 5900/5865, 5745/25*, 5656/26*
Yearly support: 5405, 5246, 5005
Resistance Levels
Intra-day resistance: 5883, 5907*, 5922*/5940*
Daily resistance: 5945/5951*, 5975, 6028/48*
Weekly resistance: 5995, 6030*/68, 6108*
Monthly resistance: 5951, 6051, 6138*/90
Yearly resistance: 6165/6460*, 6515/6640, 7300
Yearly View
Bullish: As long as 5405/5246 holds, targets 6515, 7300+.
Bearish: If bears hold 6051, targets 5740, 5405, 5330-.
#NQ:
Key Levels
Below 21300/380, bears keep momentum from Friday.
Bears control below 21900.
Bears lose control step by step: 21380 → 21550 → 21810*/900.
Targets: 20805, 20730, 20675 — in play as long as 21380 holds. Probability decreases as bears reclaim higher levels.
Bounce likely from 20805/20675 if price drops first before bouncing towards 21380.
Big Picture
Bullish if 21810 is reclaimed on daily: Targets 22080, 22310, 650*, 23230+.
Bearish until 21810 is claimed on the daily: Targets 20510/405- with 21000/20940 as intermediate levels to watch.
Support Levels
Intra-day support: 20940, 20900, 20830/805*
Daily support: 20940, 20805*/740, 20675*
Weekly support: 20940*, 20805/675, 20510*/405*
Monthly support: 20940*, 20070*/20010*, 19800*
Yearly support: 19650/500*, 18590/18400*, 17465
Resistance Levels
Intra-day resistance: 21045*, 21100, 21180*, 21300*/325*
Daily resistance: 21300/380*, 21550, 21810*/21900*
Weekly resistance: 21550, 21750*, 21900*/22080
Monthly resistance: 21450, 21900, 22425/525
Yearly resistance: 22060/22310, 22650/23610, 24620/26700
Yearly View
Bullish: As long as 19500/18400 holds, targets 23600, 24620, 26700, 27800+.
Bearish: If bears hold 22060/22310, targets 5740, 5405, 5330-.
#RTY:
Key Levels
Below 2245, bears keep momentum from Friday.
Bears control below 2310.
Bears lose control step by step: 2255 → 2278 → 2305*/2310.
Targets: 2181, 2132, 2100 — in play as long as 2255 holds. Probability decreases as bears reclaim higher levels.
Bounce likely from 2181 if price dips first before testing 2255.
Big Picture
Bullish if 2310 is claimed on the daily: Targets 2363, 2386, 95+.
Bearish if 2181 fails to hold on the daily: Targets 2133, 2101*/2091-.
Support Levels
Intra-day support: 2191, 2181*, 2172
Daily support: 2194/81, 2132, 2100/2091*
Weekly support: 2194*/2181*, 2100/2091*, 2058
Monthly support: 2194/2181*, 2068/2033*, 1983
Yearly support: 2194/2181*, 2058*, 1972*
Resistance Levels
Intra-day resistance: 2207, 2214, 2222*, 2240, 2250/55
Daily resistance: 2245/55*, 2287, 2310
Weekly resistance: 2305*, 2373, 2405*
Monthly resistance: 2260, 2315*, 2435/45*
Yearly resistance: 2463, 2615/2756, 3000
Yearly View
Bullish: As long as 2181/2058 holds or is reclaimed, targets 2315, 2463, 2615/2756+.
Bearish: If bears hold 2315/2445, targets 2081*, 2058*, 1972, 1916-.
#YM:
Key Levels
Below 42905, bears keep momentum from Friday.
Intra-day bears lose control step by step: 42305 → 42480 → 42690/860.
Bears control below 43750.
Bears lose control step by step: 42905 → 43380 → 43750.
Targets: 42000/41920, 41790, 41670 — in play as long as 42905 holds. Probability decreases as bears reclaim higher levels.
Bounce likely from 42000/41920 if price moves down first before testing 42905.
Big Picture
Bullish if 43750 is claimed on the daily: Targets 43970*, 44150, 44240*, 44485+.
Bearish if 43000 fails to hold on the daily: Targets 42000, 41970**, 41790- (currently in play).
Support Levels
Intra-day support: 42150*, 41985*, 41920*
Daily support: 42200/21950, 41840, 41670*
Weekly support: 42150*, 41790/670, 41425*
Monthly support: 41970**/41790*, 40350*/40030, 39590*
Yearly support: 40330*/41260, 40100/39335, 37900
Resistance Levels
Intra-day resistance: 42305*, 42420/480*, 42675, 42860*
Daily resistance: 42905, 43035, 43380, 43670/750*
Weekly resistance: 43025, 43410*, 43960*
Monthly resistance: 43410, 44220, 45050/45095
Yearly resistance: 45050, 46975, 48050, 49685
Yearly View
Bullish: As long as 41790/40100 holds or is reclaimed, targets 45050, 46975, 48050, 49685+.
Bearish: If bears hold 44485/45050, targets 41790/40100/37870-.
Here’s my cheat sheet for spotting trend changes:
Uptrend to Downtrend:
Fail key support levels.
Reject first support in back tests.
Sell-the-rally mania.
Breakdowns with staying power.
Form lower highs & lows.
Downtrend to Uptrend:
Claim key resistance levels.
Hold second support in pullbacks.
Buy-the-dip frenzy.
Breakouts with staying power.
Form higher highs & lows.
Signs of Shifting to Sideways Action:
Breakouts or breakdowns often lack follow-through.
Alternating highs and lows on lower time frame.(no clear higher/lower highs & lows)
Prices consolidate in narrow ranges: 30-50 points for #ES, 100-150 points for #NQ.
Test and hold key levels, then test and reject resistance (or vice versa).
Intra-day dips into support or resistance quickly reclaimed.
Guidelines for Entry Confirmation
Candle Close Rules:
Intraday: Confirm breakouts/failures with 15m/hourly candle close at intraday levels.
Daily: Confirm with hourly/4-hourly candle close at daily levels.
Weekly: Confirm with daily candle close at weekly levels.
Handling Breakouts:
High Probability of Initial Failure:
Be prepared to lose the first breakout trade if it reverses.
Use the next reversal candle for a quick switch to short if risk reward is at least 1:2.
Second attempts at breakout levels are likely more successful.
Better Entries: After a failed breakout, often you get a better long entry at the next support level when price reverses upward.
Typical Stop Loss Examples:
#ES_F:
Intraday Trades: Use a 3-5 point SL with a minimum 10-point target.
Swing Trades: Use a 10-15 point SL with a minimum 30-point target.
#NQ_F:
Intraday Trades: Use a 20-25 point SL with minimum 40-50 point target.
Swing Trades: Use a 30-35 point SL with minimum 60-80 point target.
Always maintain a minimum 1:2 risk/reward ratio with targets.Intraday trades focus on quicker moves, while swing trades aim for larger targets.Use partial exits for scaling out and securing profits while leaving room for extended targets.Stick to stop-loss levels to manage risk.Avoid over-trading; wait for clear setups.Monitor price action at key levels for confirmation.Be flexible and reenter only if conditions realign after a failure.
What does bear pressure or bulls weak below a level means?
More Sell the rally (STR) than Buy the dip (BTD) until claimed on a higher time frame.
Trading Time frames: Candle close above
Intraday: 1 or 4 hrly
Short-term: Daily
Long-term: Weekly
Note about Terminology:
In my weekly reports and X (Twitter) posts, I often refer to terms like "must hold," "claim," or "fail." Here's a quick explanation of what these terms mean:
For intraday analysis: I consider the 15-minute or 1-hour candle close.
For trades spanning overnight to two days: I focus on the 4-hour candle close.
For a weekly or longer-term outlook: I rely on the daily candle close.
close above: claimed / close below: failed
These references are also available in the pinned thread on my X profile. I strongly recommend reading this thread for a deeper understanding of my chart analysis. If I get lot more subscribers and engagement, I plan to elaborate on my methodology in a separate Substack post in the future, the pinned thread on my X profile offers valuable insights for now.
Read this thread on X to learn about my chart reading method and examples of hold/fail/claim/reject setups for trade execution
Curious about your trading experiences. Share your trading moves inspired by this newsletter – the wins, the almost-wins, and the lessons learned. Drop your insights in the comments below or over on X (formerly Twitter). Let's learn and grow together!
Be nimble and adjust your strategies according to market conditions and the mentioned support and resistance levels. Monitor flag levels for early signs of bias shifts. If you're not following me on X @trdnvestor , consider doing so for daily updates.
Wish you a great trading week!
Disclaimer: This is NOT financial advice. I am NOT a financial advisor.