Weekly Charts Reading for 1/1 - 1/5
Happy New Year!
How’s last week?
As expected, the market witnessed two directional moves
#ES made new ATH but S&P 500 (#SPX) cash index has yet to achieve a new all-time high.
#NQ: made another ATH & continues to maintain above its previous ATH
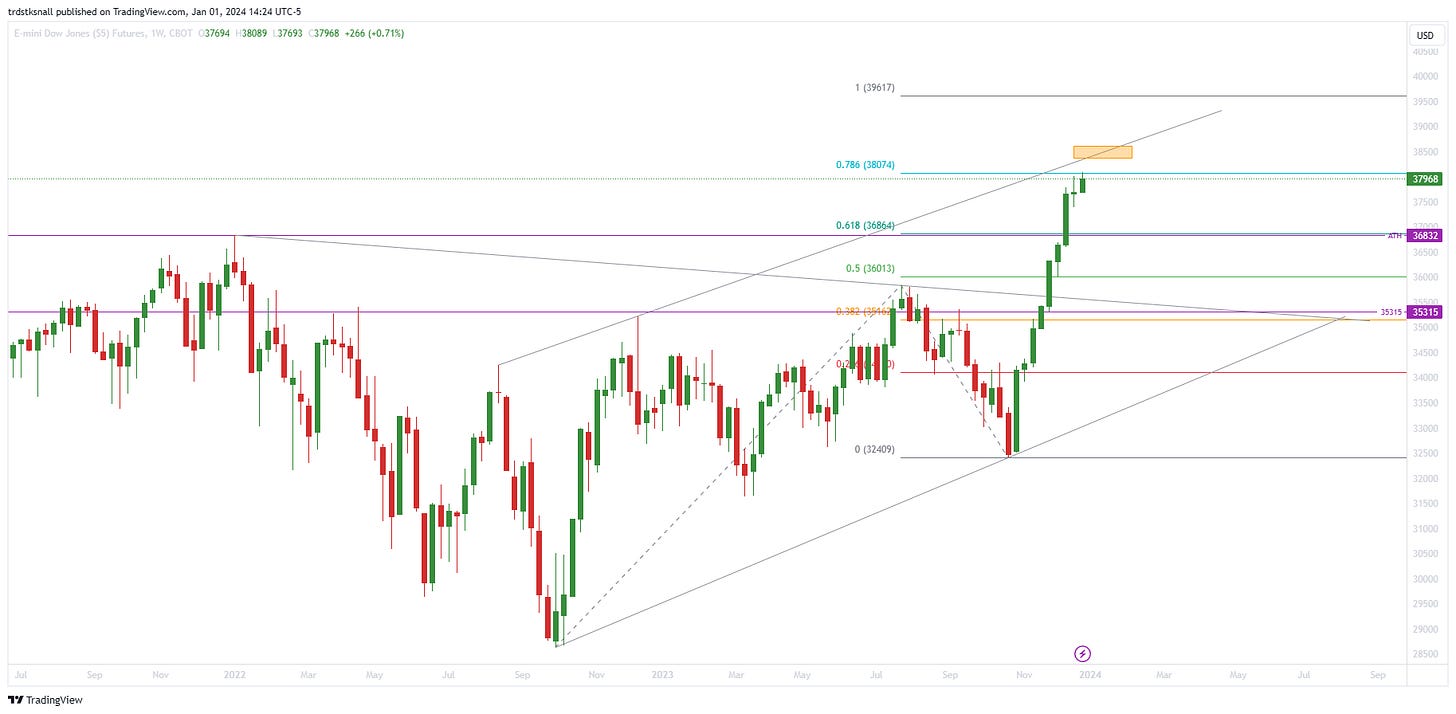
#YM: Experienced a modest upward movement.
#RTY: Successfully reached the first weekly targets of 2089 and 2094 but pulled back sharply, with its current position just managing to hold onto last week's support.
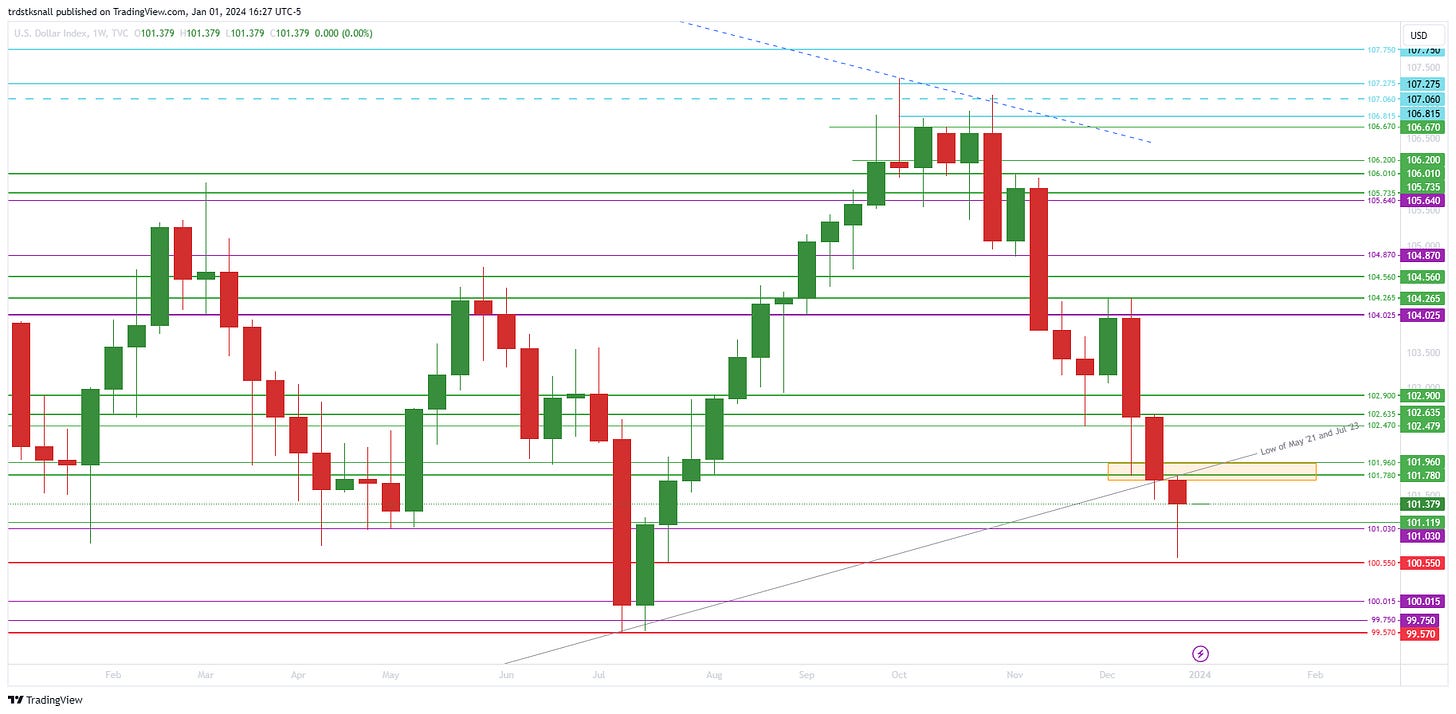
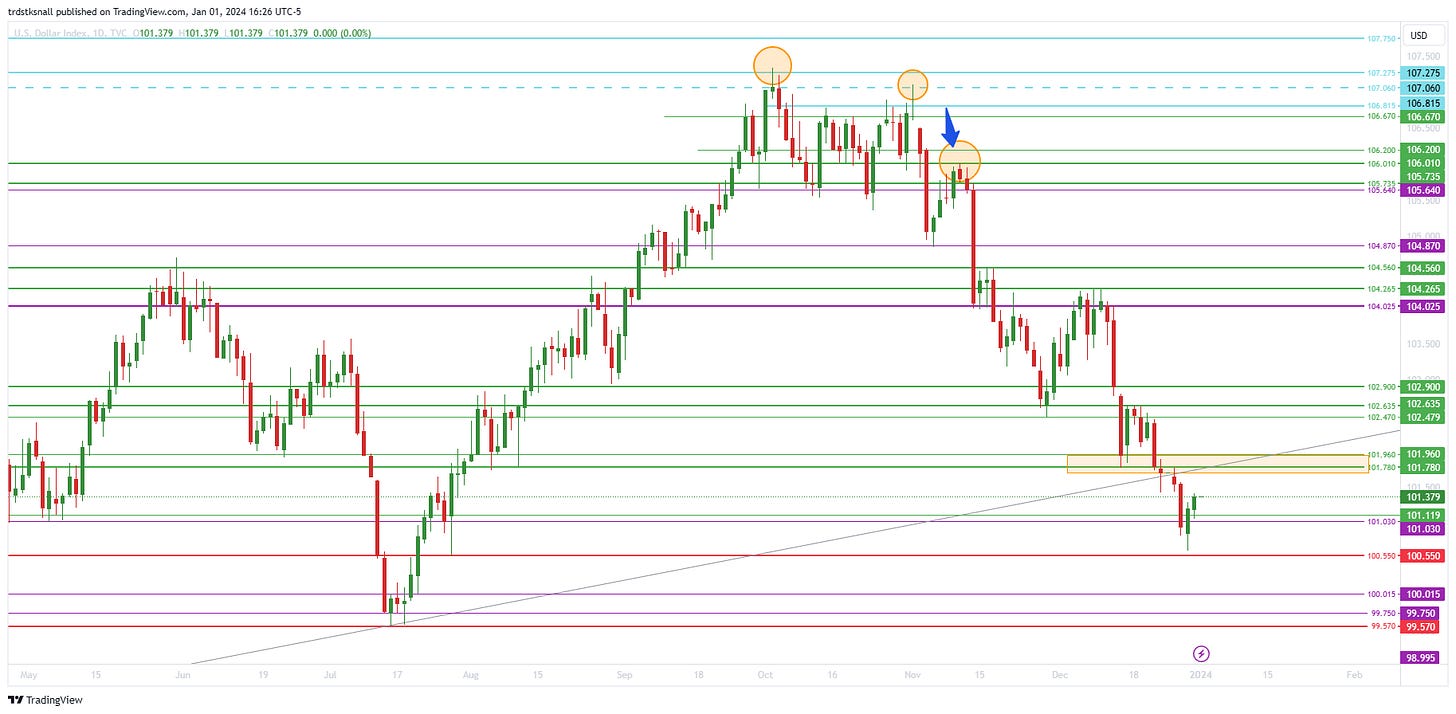
#DXY: The U.S. Dollar Index (#DXY) persists in its downward trajectory.
Read here how I use this Weekly Newsletter in my daily trading
If you find my content valuable, please hit the like button on Substack and consider sharing the newsletter link on X. Your support through likes, restacks, shares, and reposts motivates me to continue publishing.

Feel free to comment with specific questions and suggestions to enhance the usefulness for active traders.
Week Ahead (1/1 – 1/5)
Thursday and Friday's market activity is likely influenced by year-end adjustments or profit-taking, signaling potential signs of a local top.
Despite this, crucial support levels are currently holding, maintaining a bullish bias.
Although intra-day support faltered, daily and weekly support levels remain resilient.
A note of caution is warranted, particularly due to the actions on Thursday and Friday.
Overall, confidence in a bullish continuation from this point is limited.
It's worth noting that January tends to be a seasonally bearish month, typically initiating after the first week.
Consequently, I'm elevating my early detection flag levels.
In general, a 5-6% pullback over 3-4 weeks should still preserve the bullish trend from the last quarter. Safeguarding those levels becomes crucial during the upcoming pullback.
However, abrupt 1-2% rug pull days could make bears happy.
Will we get a Santa Claus rally?
Checking the numbers for December: #ES up 4.98%, #NQ up 6.31%, #YM up 4.76%, and #RTY with a whopping 13.37% surge.
How much more do you think Santa's bringing?
If support levels identified holds, maybe an extra 0.5% - 1.25%?
Keep in mind, if there's a rally, it usually wraps up in the first couple of days of January.
Checkout Yearly levels for the market
Note about levels above ATH
Upside targets are estimated without left-side confirmation on the chart, utilizing a combination of Fibonacci and trend lines across multiple time frames. Feel free to reach out if these levels prove effective; otherwise, your understanding is appreciated.
These levels are subject to refinement as prices evolve throughout the days.
In the event of new highs, prioritizing profit-taking based on risk-to-reward multiples is recommended, rather than waiting for specific target levels to be reached.
Feel free to scroll down to the end of the report to get a rundown on some of the terms I'm throwing around, like "hold," "claim," and “fail”
Disclaimer: This is NOT financial advice. I am NOT a financial advisor.
Events Calendar:
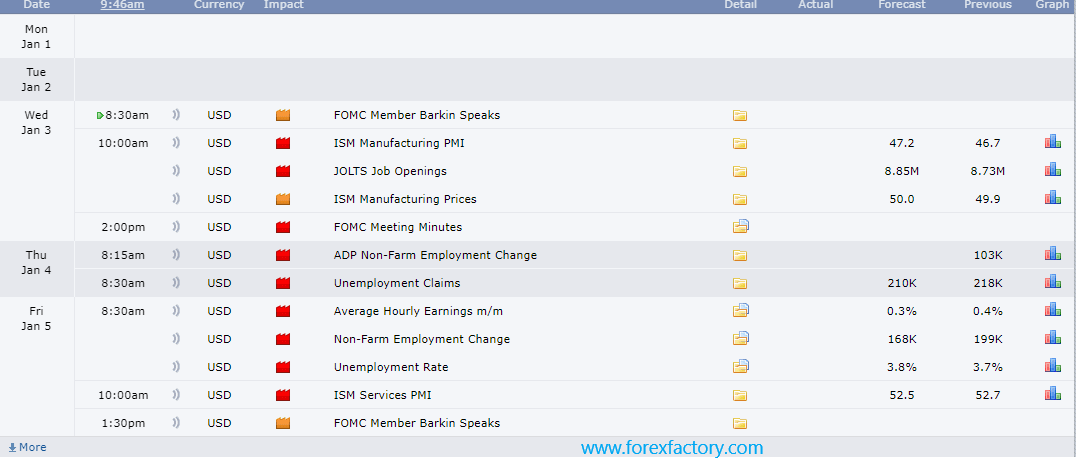
Despite being a short week, the upcoming week is packed with significant reports, along with speeches from some Federal Reserve members starting on Wednesday. The release of the FOMC meeting minutes on Wednesday has the potential to introduce increased volatility to the market.
#ES_F / $SPX Futures:
📈 Weekly: Cautious 🐂 📊 Daily: Cautious 🐂
Analysis:
Almost mirroring the previous week, the market displayed a predominantly green week.
While not a robust finish, Friday's morning flush is still holding support.
Although #ES futures achieved a new ATH, the cash index SPX has yet to reach this milestone
Hence maintaining the bullish bias.
However, caution needs to be exercised until a close above 4837, as lingering bearish doubts persist.
Bulls need to hold 4807 and claim 4822 before Tuesday's market opening to demonstrate bullish intention.
A move below 4807 could trigger a descent to 4789/4784, with a reminder that these levels were the support in the previous week but were not tested.
A close below 4797 likely to start more bearish activity, prompting the orange flag to move to 4797.
Ideally, bulls should maintain 4750/4740 over the next few weeks.
It's crucial for bulls to hold 4603 or 4548 to keep the last quarter's uptrend intact.
Failure of 4548 would only be define with a weekly close below 4558, while a daily close below 4603 already strengthens bearish confidence.
Yearly View:
🐂 Bullish: As long as 4420/4350 holds, 5615/6110+ is in focus.
🐻 Bearish: Determined when the monthly trend turns bearish.
Monthly Viewpoint:
🐂 Bullish Goal: As long as 4603/4548 holds/reclaimed, 5256 is in focus.
🐻 Bearish Goal: Decided upon observing a change in trend on a weekly basis.
Weekly Perspective:
🐂 Bullish: If 4807 holds, 4857/4867/4895 is in play.
🐻 Bearish: If 4797 fails, 4750/4740- is in play.
Level by Level Bullish Play (on Daily):
If 4807 support holds, 4822/4837 are next.
Successfully claiming 4837 targets 4851/4857.
A close above 4857 shifts focus to 4867/4880.
Level by Level Bearish Play (on Daily):
If 4797 fails, 4789/4784 becomes the target.
If 4784 fails, consider 4769/4762.
A failure at 4762 directs attention to 4750/4740-.
Zoomed-out View:
Bullish: As long as 4750/4740 holds or is reclaimed, 5000/5025 is in play.
Bearish: If bears hold 4835 and 4740 fails to hold, 4660/4603 is in play.
🔑 Key Levels:
Resistance: 4822, 4837, 4846, 4851/4857, 4867
Support: 4807, 4800/4797, 4789/4784, 4762, 4750/4740
Possible Trade Plans:
Considering the analysis and key levels, potential trade plans include:
Long Trade:
If the market opens lower but holds 4807, consider going long with a stop loss below 4807 and targets at 4822 & 4837.
If the market opens lower but holds 4800, go long with a stop loss below 4800 and targets at 4822, 4831, 4837, and 4846.
Wait for the market to claim 4837, observe signs that 4827 is holding, and enter a long position with a stop loss below 4827, targeting 4846, 4851, and 4857.
Short Trades:
If the market opens up but fails to hold 4822/4837, short with a stop loss above 4822/4837 and targets at 4797, 4784, and 4769.
If the market fails to hold 4797, bears reject the 4800 level, assess the setup, and consider a short position with a stop loss just above 4800 and a target of 4769 & 4762.
If the price moves below 4807 and doesn't quickly recover above 4810 from 4800, look for a bearish setup around 4800 on a lower time frame with a stop loss above 4807 and targets at 4795, 4789, and 4784.
Red Flags:
As the market moves up, adjust flag levels for early detection of a short-term trend change:
Orange Flag: A close below 4797 questions the daily uptrend.
1st Red Flag: A close below 4745 on a red day suggests a potential challenge to the short-term weekly uptrend bias.
2nd Red Flag: If the market closes below 4650 on a red day, it indicates a potential voiding of the short-term weekly uptrend bias.
#NQ_F / #NDX Futures:
📈 Weekly: Cautious 🐂 📊 Daily: Cautious 🐂
Analysis:
The market marks its 9th consecutive green week, albeit narrowly in my assessment.
The price action on Thursday and Friday does not exhibit bullish characteristics, prompting a very cautious bullish bias this week.
While my confidence in the bullish bias is diminishing, the market could surprise with one more push up before a potential significant pullback.
Consequently, I'm adjusting the must-hold support closer to Friday's lows, raising the orange flag to 16965.
It's imperative to note that until a weekly close below 16575 occurs, the breakout remains in play.
A red day close below 16575 signals the breakdown of the breakout.
The #NASDAQ composite is still a considerable distance from reaching a new high.
As long as the market holds above 16830, the bulls maintain control.
Below 16830, bears gain confidence.
Ideally, bulls would want to sustain 16930/16890 to propel momentum towards a pullback to 17110/17205 and allow for sideways movement above 16575 for a few weeks.
Similar to last week, moving up to a 'safe distance' is critical for bulls to safeguard the breakout from an impending rug pull.
In any scenario, 16755 and 16575 are pivotal levels for bulls to defend the recent breakout.
If 16965 fails to hold and the price drops to 16890 but swiftly recovers above 16985 on the same day, it signals that bulls are still in control, even after a substantial move down.
Yearly View:
🐂 Bullish: As long as 14265/14140 holds, 20320/22640 is in play.
🐻 Bearish: Determined when the monthly trend turns bearish.
Monthly Viewpoint:
🐂 Bullish Goal: As long as 15955/15465 holds, 19035/19710/20190 is in play.
🐻 Bearish Goal: Will decide upon seeing a change in trend on a weekly basis.
Weekly Perspective:
🐂 Bullish: If 16985/16965 holds AND 17132 is reclaimed, 17250/17270+ is in play.
🐻 Bearish: If 16965 fails, 16890/16790/16730- is in play.
Level by Level Bullish Play (on Daily):
If 16985/16965 holds and 17045 is reclaimed, 17110/17132 is in play.
Once 17132 is claimed, 17180/17205 becomes the next focus.
Claiming 17180 sets the stage for 17250/17270.
Level by Level Bearish Play (on Daily):
If 16965 fails, 16930/16890 is in play.
A failure at 16890 leads to 16830/16790.
If 16790 fails, 16755/16730 is the next target.
Zoomed-out View:
Bullish: As long as 16985/16965 holds or is reclaimed, 17132/17270 is in play.
Bearish: If bears hold 17132 and 16965 fails to hold, 16790/16730 is in play.
🔑 Key Levels:
Resistance: 17045, 17110/17132, 17180/17205, 17245/17270, 17325.
Support: 16985/16965, 16930/16890, 16830/16790*, 16755/16730*, 16670/16630.
Possible Trade Plans:
Considering the above analysis and key levels, potential trade plans include:
Long Trade:
If the market opens down and shows signs of holding 16985, consider going long at 16995 with a stop loss below 16985. Targets include 17045, 17085, and 17110.
If the market opens down but holds 16965, and on a lower timeframe, if 16995 is claimed, go long around 16995 with stop loss below 16985. Targets include 17045, 17085, and 17110.
Wait for 17132 to be claimed, look for signs of 17110/17095 holding, then go long at 17110/17095 with stop loss below these levels and 17132. Targets include 17180 and 17205.
Short Trades:
If the market opens up and if 16995/16985 hasn't yet been tested, and shows signs of rejection of 17045 on a lower timeframe, go short with a stop loss above 17045. Targets include 16995, 16965, and 16930.
If the market holds 16985 and hits 17110/17132 but rejects it and claims 17110/17040 in a pullback on a lower timeframe, go short around 17110/17045. Stop loss above 17110/17045, with targets at 16985, 16965, and 16930.
If the market fails to hold 16985, on a lower timeframe, look for a short entry around 16985 with a stop loss above and targets at 16930, 16890, and 16830.
Red Flags:
As the market moves up, adjust flag levels for early detection of a short-term trend change:
Orange Flag: A close below 16965 questions the daily uptrend.
1st Red Flag: A close below 16755 on a red day may suggest that the short-term weekly uptrend bias is in question.
2nd Red Flag: If the market closes below 16575 on a red day, indicating a potential voiding of the short-term weekly uptrend bias.
#YM_F / #DJI Futures:
📈 Weekly: Cautious 🐂 📊 Daily: Cautious 🐂
Analysis:
The week marks another all-time high (ATH) with a green close, and Friday sees bulls holding support.
Consequently, the bullish bias continues with caution.
Notably, bulls are holding #YM better than #ES or #NQ.
In the event of down to sideways action, bulls ideally want to stay above 37190; otherwise, bears gain strength below that.
This week, the bull/bear line is at 37925.
Bullish trades are considered above, and bearish trades below 37925.
A drop below 37925, with a quick recovery above 37960 on the same day, will keep bulls in play.
If 37818 fails on the daily, 37465 comes into focus.
Yearly View:
🐂 Bullish: As long as 35315/33915 holds, 41900/45030+ is in play.
🐻 Bearish: Will determine when the monthly trend turns bearish.
Monthly Viewpoint:
🐂 Bullish Target: As long as 36750/36602 holds, 39210/41310+ is in play.
🐻 Bearish Target: Will decide upon seeing a change in trend on a weekly basis.
Weekly Perspective:
🐂 Bullish: If 37960/37925 holds and 38030 is reclaimed, 38260/38400 is in play.
🐻 Bearish: If 37925 fails, 37818/37692/37465- is in play.
Level by Level Bullish Play (on Daily):
If 37960/37925 holds, 38030/38110 is in play.
Once 38110 is claimed, 38230/38260 becomes the next focus.
Claiming 38260 sets the stage for 38355/38400.
Level by Level Bearish Play (on Daily):
If 37925 fails, 37860/37818 is in play.
A failure at 37818 leads to 37692 next.
If 37692 fails, 37585/37465 is the next target.
Zoomed-out View:
Bullish: As long as 37465/37390 holds or is reclaimed, 38400 is in play.
Bearish: If bears hold 38030 and 37818 fails to hold, 37465/37390/36975 is in play.
🔑 Key Levels:
Resistance: 38030, 38110, 38175, 38230/38260, 38355/38400.
Support: 37960/37925, 37860/37818, 37692, 37585/37545, 37465*.
Possible Trade Plans:
Considering the above analysis and key levels, potential trade plans include:
Long Trade:
Depending on the price before arriving at two key support levels, 37960, 37925, and 37860, there could be multiple potential long trade opportunities.
If 38030 is claimed, look for signs of 38000 holding on lower time frames and go long with a stop loss below 38000. Targets include 38110, 38175, and 38230.
Short Trades:
If 38030 is rejected on a lower time frame and 37925 hasn't been tested, go short around 38030 with a stop loss above 38030. Targets include 37925, 37860, and 37818.
If 37925 fails, depending on the actual setup, go short near 37960 with a stop loss above 37960. Targets include 37860, 37818, and 37692.
Red Flags:
As the market moves up but not significantly, the flag levels remain the same:
Orange Flag: A close below 37818 questions the daily uptrend.
1st Red Flag: A close below 37390 on a red day may suggest that the short-term weekly uptrend bias is in question.
2nd Red Flag: If the market closes below 36760 on a red day, indicating a potential voiding of the short-term weekly uptrend bias.
#RTY_F / #RUT Futures:
📈 Weekly: Cautious 🐂 📊 Daily: Cautious 🐂
Analysis:
Last week unfolded as expected, hitting the 2089/2094 targets and experiencing a sharp pullback.
Thursday/Friday marked a clear bearish move; however, on Friday, bulls precisely held last week's first support at 2044 (2042.3 low) and closed just above it, keeping bullish hopes alive.
There's a slight chance that bulls will prevent the price from moving below 2044, in which case, a back test of 2080/2089 is plausible.
Due to the close near the support, the orange flag is moved up aggressively to 2042.
A close below 2042 could indicate more red days.
Yearly View:
🐂 Bullish: As long as 1867 holds, 2047/2461/2575+ is in play.
🐻 Bearish: Will determine when the monthly trend turns bearish.
Monthly Viewpoint:
🐂 Bullish: As long as 1994/1970 holds, 2052/2461+ is in play.
🐻 Bearish: Will determine when the weekly trend turns bearish.
Weekly Perspective:
🐂 Bullish: If 2042 holds, 2081/2094/2108 is in play.
🐻 Bearish: If 2042 fails, 2010/2000/1970- is in play.
Level by Level Bullish Play (on Daily):
If 2042 holds, 2060/2081 is in play.
Once 2081 is claimed, 2094/2108 becomes the next focus.
Claiming 2094 sets the stage for 2120/2130.
Level by Level Bearish Play (on Daily):
If 2042 fails, 2030 is in play.
A failure at 2030 leads to 2010 next.
If 2010 fails, 2000/1993 is the next target.
Zoomed-out View:
Bullish: As long as 2000 holds or is reclaimed, there's no reason 2108/2169 won't be tested.
Bearish: If bears hold 2081 and 2042 fails to hold, 2000/1970 is in play.
🔑 Key Levels:
Resistance: 2060*, 2081, 2089/2094*, 2108*, 2120/2130.
Support: 2042*, 2030, 2010, 2000*/1993, 1977/1970*.
Possible Trade Plans:
Considering the above analysis and key levels, here are some potential trade plans:
Long Trade:
If signs of holding 2042 on a lower time frame are observed, go long with a stop loss below 2044 and targets at 2065, 2072, 2089.
If 2081 is claimed, look for signs of holding 2060 on a lower time frame and go long with a stop loss below 2060 and targets at 2089, 2094, and 2108.
Short Trade:
If 2042 fails, depending on the actual setup, go short near 2050 with a stop loss above 2050 and targets at 2030, 2010, and 2000.
Red Flags:
As the market moves up, all flag levels are moved up aggressively for early detection of a short-term trend change as below:
Orange Flag: A close below 2042 questions the daily uptrend.
1st Red Flag: A close below 2000 on a red day may suggest that the short-term weekly uptrend bias is in question.
2nd Red Flag: If the market closes below 1970 on a red day, indicating a potential voiding of the short-term weekly uptrend bias.
#DXY / $USD:
📈 Weekly: Cautious 🐻 📊 Daily: Cautious 🐻
Analysis:
As anticipated, #DXY continued its downward trajectory, hitting the 101.030 target and nearing 100.550 (100.617 low).
With the week closing in the red and below the support trend line, the bearish bias is maintained.
The bounce and close above 101.030 on Thursday/Friday bring some caution to bears.
As long as 101.650/101.780 is defended by bears (no close above), a move back down to 100.550 & 100.015 is likely.
It's worth noting that the inverse correlation between USD and #NQ #ES may persist, potentially influencing further upward movement in #NQ #ES #RTY.
🔑 Key Levels:
Resistance: 101.650/101.780*, 101.960, 102.470/102.635, 104.025*, 104.265
Support: 101.030, 100.550, 100.015, 99.750, 99.570
Green Flags:
As the market moves down, the flags are adjusted aggressively for early warnings of a reversal.
Lime Flag: A close above 101.780 on a green day could indicate that the daily downtrend bias is in question.
1st Green Flag: If the market closes above 102.900 on a green day, it may suggest that the short-term weekly downtrend bias is in question.
2nd Green Flag: A significant bullish confirmation could occur if the market closes above 104.025 on a green day, potentially voiding the short-term weekly downtrend bias.
Note about Terminology:
In my weekly reports and X (Twitter) posts, I often refer to terms like "must hold," "claim," or "fail." Here's a quick explanation of what these terms mean:
For intraday analysis: I consider the 15-minute or 1-hour candle close.
For trades spanning overnight to two days: I focus on the 4-hour candle close.
For a weekly or longer-term outlook: I rely on the daily candle close.
close above: claimed / close below: failed
These references are also available in the pinned thread on my X profile. I strongly recommend reading that thread for a deeper understanding of my chart analysis. While I plan to elaborate on my methodology in a separate Substack post in the future, the pinned thread on my X profile offers valuable insights for now.
Curious about your trading experiences. Share your trading moves inspired by this newsletter – the wins, the almost-wins, and the lessons learned. Drop your insights in the comments below or over on X (formerly Twitter). Let's learn and grow together!
Be nimble and adjust your strategies according to market conditions and the mentioned support and resistance levels. Monitor flag levels for early signs of bias shifts. If you're not following me on X @trdnvestor , consider doing so for daily updates.
Wishing you a very Happy, Healthy and Profitable New Year! 📈💰
Disclaimer: This is NOT financial advice. I am NOT a financial advisor.


What do you use to determine that 4797 is a key level for continued downside? Thanks!