

How It Works and When to Use It
The Breakdown Short is a powerful strategy that involves shorting when price fails to hold a key support level. But here’s the catch — not all breakdowns are created equal. The success of this strategy largely depends on context and market structure.
Breakdowns are most effective when support has already been tested multiple times and buyers have been weakened. If you try to short a breakdown on the first test of support, especially after a strong downward move, you're walking into a high-risk trap. Why? Because first tests of key support often lead to bounces rather than clean breaks.
Instead, the best Breakdown Short setups happen after a lower high has formed and the market shows signs of a bearish trend. This setup confirms that buyers are running out of steam, increasing the chances that support will fail on a second or third test.
In short:
➡️ First test of support? Expect a bounce.
➡️ Lower high before breakdown? Now we're talking.
➡️ Second or third test of support? High probability short.
Let’s break down when and how to use this strategy to maximize edge.
1. What is a Breakdown Short?
A Breakdown Short happens when price fails to hold a key support level and breaks below it. It’s an entry strategy that bets on continued downside momentum once buyers lose control.
Think of support as a floor that keeps price from falling. When the floor collapses, price usually drops quickly as buyers panic and sellers pile in.
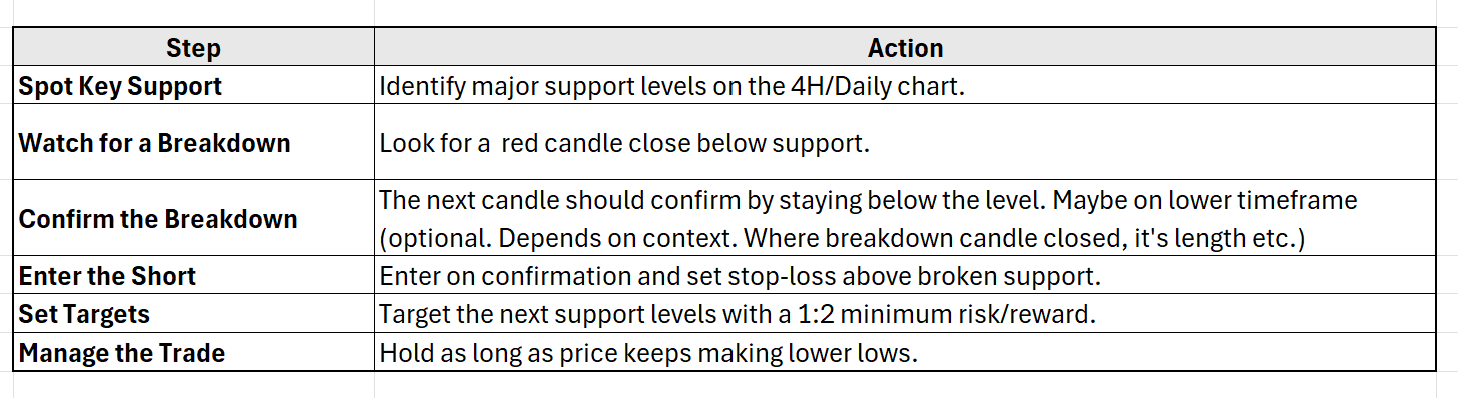
How to Spot a Breakdown Short Entry on a Clean Candlestick Chart:
Here’s how you spot a Breakdown Short without using any indicators:
Price approaches a key support level.
Green candles turn into red candles as price reaches support.
A full red candle closes below the support level.
Next candle confirms the breakdown by staying below support.
2. Key Clues to Confirm a Breakdown:
You need two key confirmations to ensure the breakdown is valid:
A Full Candle Close Below Support
The first sign of a breakdown is when a full red candle closes below the support level.
A wick below support is not enough — you need the candle body to close below support.
Continuation in the Next Candle
The next candle should stay below support to confirm that buyers have failed to reclaim the level.
If the next candle is weak green or another red candle, it confirms that sellers are in control.
Next candle confirmation is optional in case of rug-pull or depending on where breakdown candle closed, how larget that previous candle been etc.
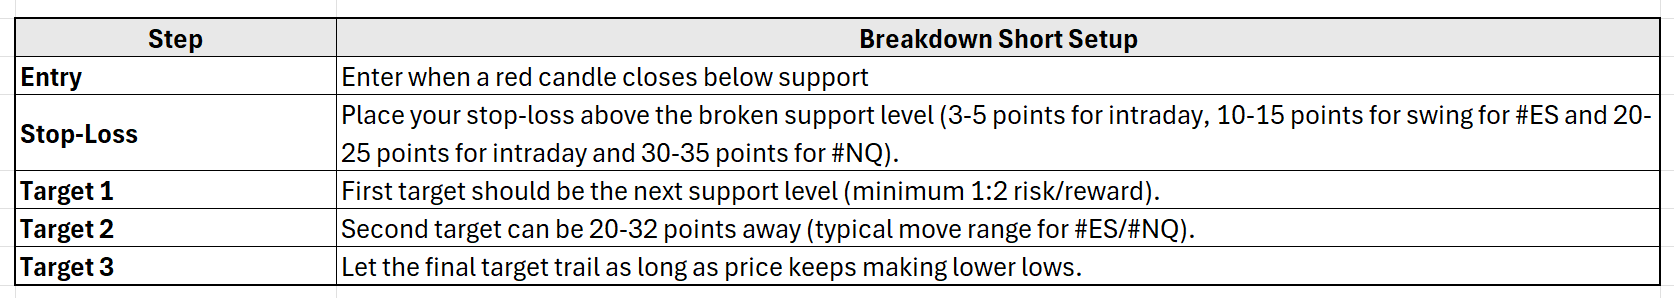
3. Entry, Stop-Loss, and Targets for a Breakdown Short
Here’s how you set up your trade:
4. What Does a Good Breakdown Short Look Like?
Here’s what to watch for when the breakdown is valid:
No Strong Bounce Back After Breakdown
Once support breaks, price should stay below that level.
If price bounces back above support, the breakdown might fail.
Multiple Red Candles After the Breakdown
A valid breakdown is often followed by several red candles.
If the next candles are weak green bounces, it’s still safe to hold the short.
Retest of Broken Support That Fails
Sometimes, after the breakdown, price will retest the broken support.
If the retest fails and price rejects again, it’s a great opportunity to add to your short position.
5. Scenarios:
1. Breakdown After Support Test → Bounce to Resistance → Failure to Hold Support (First Scenario)
Setup:
Support Test: Price tests a support level (e.g., 5930) and then bounces up towards a resistance level.
Bounce to Resistance: The price moves up and reaches resistance (e.g., 5959), where it rejects and starts coming back down.
Failure to Hold Support: As price retraces downward, it fails to hold the previously tested support (5930) and breaks through, signaling the continuation of the downtrend.
Ideal Market Conditions:
This setup is more effective in a strong downtrend, where previous support levels are likely to break after being tested.
The bounce to resistance provides a confirmation that the level is now acting as resistance, and when support fails to hold, it gives a strong entry for a short trade.
It works well when the market shows signs of weakness, and price is unable to hold the support level, reinforcing the bearish momentum.
Why It Works:
The rejection at resistance and subsequent failure to hold support indicate that buyers are not strong enough to push price higher, while sellers are gaining control.
The breakdown through the support level suggests that the market sentiment is shifting bearish, with no demand at the lower level.
2. Breakdown from Below → Retest from the Bottom → Rejection (Second Scenario)
Setup:
Price initially breaks below a support level (e.g., 5930).
After the breakdown, the price retests the level (e.g. 5920) from below (acting as resistance) and rejects it.
The rejection confirms that the support is no longer valid, and price will likely continue downward.
Ideal Market Conditions:
This scenario is best in a strong downtrend where price is moving aggressively lower.
The initial breakdown of support shows that sellers are in control, and the retest from below confirms that the level is now acting as resistance.
Why It Works:
The failure to reclaim the support level during the retest signals continued selling pressure.
The second rejection confirms that the market is not interested in higher prices, leading to further downside movement.
In the first scenario, if you're already short when the resistance is rejected at the support level, you have three options:
Close Entire Short Position if the price bounces, indicating that the support may hold.
Close Partial Short Position and Add to the Short if the candle closes below the support level, confirming a breakdown. You would move the stop-loss closer to the high of the entry candle.
Close Partial Short Position and Wait for Further Confirmation if price moves in a sideways or uncertain direction, giving you more time to decide on the next move.
In the second scenario, you’re more likely to initiate a new short position after the support fails and price retests from below, rejecting the level as resistance. This provides a confirmation for a strong short entry.
6. Are Failed Breakdown More Likely If It's the First Test?
The answer is YES. Breakdown shorts have a higher chance of failure if it's the first test of a major support level that price approaches with momentum. Here's why:
Understanding First-Time Support Tests:
When price reaches a key support level for the first time, especially after a sharp drop or strong momentum move, it's likely to bounce rather than break. This is because:
Fresh Buy Orders:
Major support levels usually have lots of buy orders sitting there from traders who’ve identified the level as key. These orders act as a demand wall that absorbs selling pressure.Profit-Taking by Shorts:
If the market sells off hard into support, many traders who shorted earlier will look to cover their positions at that key level, creating buying pressure.Overextended Conditions:
A momentum-driven drop into support often leaves the market oversold, making a bounce more likely.Psychological Effect:
Key levels (e.g., round numbers or previously defended levels) are psychological anchors. Traders expect them to hold the first time around, reinforcing the bounce.
When Do Breakdown Shorts Work Best?
Breakdown shorts are more reliable when:
Support has been tested multiple times. (at least one)
There’s less bounce after each test, showing buyers are weakening.
Lower highs have already formed before the breakdown attempt.
The overall market is in a clear downtrend.
If the first test of support fails to break but bounces weakly into resistance (creating a lower high), That’s when you want to consider a Breakdown Short on the next attempts at that level.
Red Flags for Failed Breakdown Shorts:
First test of a key support level.
Sharp drop into support with no prior consolidation. (maybe handled as rug-pull scenario which will be covered separately)
Support level is widely recognized (psychologically significant).
Market is not in a downtrend (e.g., sideways or uptrend conditions).
What to Do Instead?
In cases where price reaches support for the first time with momentum, it’s usually smarter to wait for a bounce and look for a Rejection Short at resistance. Then, if price fails to hold support on a second or subsequent test, you can take the Breakdown Short.
7. What if the Breakdown Fails?
Sometimes, support breaks temporarily, but buyers reclaim the level. A candle close below support followed immediately by green candle cosing above signals possible failed breakdown. If resistance level (from where recent move down started) is claimed, failed breakdown is confirmed. Here’s how to manage it:
Use a Stop-Loss Above the Broken Support Level
Keep your stop-loss tight — for example, 3-5 points for intraday trades and 10-15 points for swing trades for #ES and 20-25 points & 30-35 points for intraday & swing trades for #NQ
Wait for a Retest and Rejection
If the breakdown fails, wait for a retest of resistance and look for a rejection short.
This often happens after a false breakdown traps weak shorts.
Summary:
Example:
Key support levels for the week of January 6th, 2025 were 5930 and 5920.
5930 held four times on the hourly chart, while 5920 held twice before failing to hold on the 15-minute chart during the third attempt.
Each time support held, there was a backtest to the start of the move, which then rejected and pushed the price back down to retest the key support levels.
As the 4-hour and daily charts showed lower highs and lows, the downtrend was clear. Despite this, 5930 and 5920 held for a longer period, raising hopes for a bullish move. However, the key resistance at 5959/5962 was never broken during multiple attempts to retest it.
Ultimately, price rejected resistance and failed to hold 5920, quickly flushing lower and continuing the daily bearish trend.
#ES 4Hr chart from same week

1Hr Chart of same time frame

15min Chart of same time frame
